When it comes to accounting, it is critical to keep your financial records up to date. However, it is just as important to review financial data and reconcile any discrepancies in a timely fashion. What you need is an intelligent solution that not only provides these options, but also looks to proactively alert you to problem areas before they get out of hand. Here are some of the most important accounting reports in CORE.
Types of Accounting Reports in CORE
Accounting reports can be broken down into two generic categories: vital and useful. Vital accounting reports are those that you MUST use on a regular basis. Useful accounting reports are still important, but may not be used by your accounting team regularly.
CORE offers a wide range of accounting reports to cover all of your needs.
Vital Accounting Reports
-
Profit and Loss (Income Statement)
-
Balance Sheet
-
Cash Flow Monthly Statement
-
Cash Flow vs. Revenue
-
Accounts Receivable with Aging
-
The Accounts Payable with Aging
-
Company YTD Comparison
Other Useful Accounting Reports in CORE
-
General Ledger
-
Trial Balance
-
Financial Budgets
-
End of the Year Reports
Vital Accounting Reports in CORE
These first seven accounting reports are vital and the most-used in CORE. Your finance team uses these reports often when it comes to your business.
Profit and Loss (Income Statement)
CORE’s Profit and Loss accounting report is available on both an accrual and cash basis.
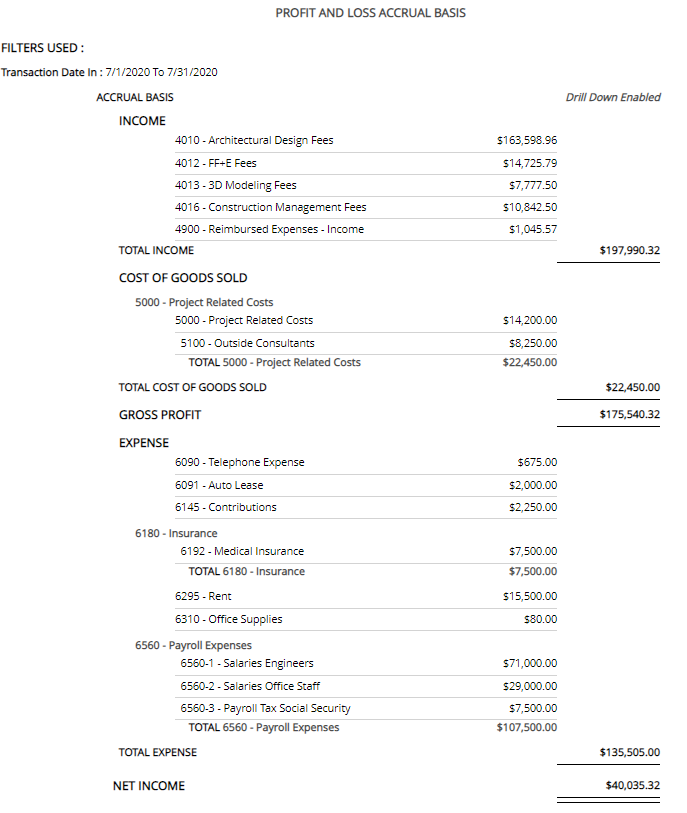
The Profit and Loss report is a standard tool used in the accounting world to display a company’s earnings across various income accounts. It enables the firm to easily identify areas of service that are performing strongly, as well as those that are not. This report then also contrasts income with the firm’s outlying expenses, categorized by expense type.
-
Gross Profit is calculated by subtracting the total “Cost of Goods Sold” from gross income.
-
Net Income is then determined by subtracting the value of any other, typically overhead, expenses.
Tip: Use the Profit and Loss YTD Comparison report for a side-by-side comparison with a previous year.
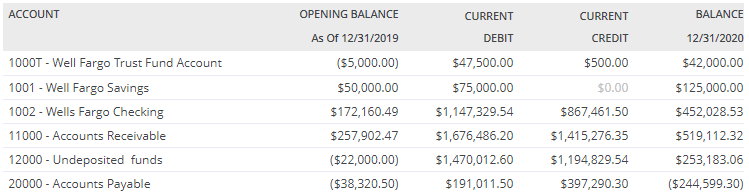
Balance Sheet
The Balance Sheet report is available on both an accrual and cash basis.
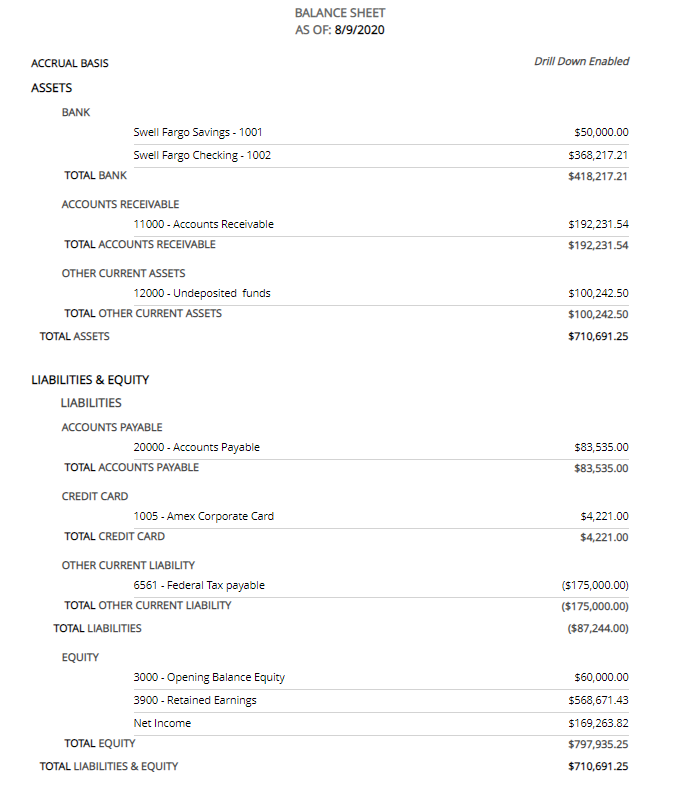
The Balance Sheet report applies to a single point of time in a business calendar year and compares the total assets and liabilities during that period. The sum of total assets should always equal the sum of liabilities (and equity), and therefore be “in balance.”
Automating the Balance Sheet using CORE brings a level of standardization and enhanced control to the balance sheet substantiation process. This is especially necessary if a high volume of accounts and/or personnel are involved in the validation process. It also helps improve efficiency, clarity, and reduces risk.
Cash Flow Monthly Statement
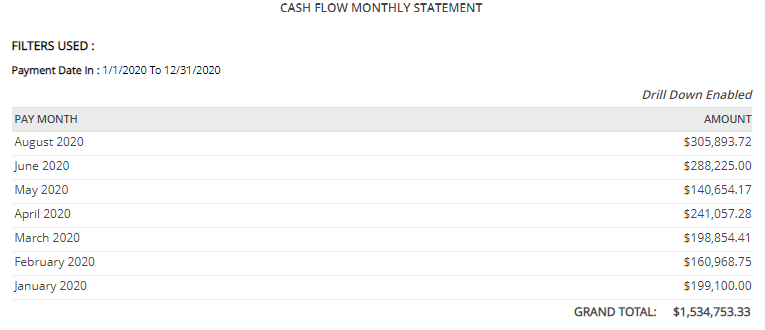
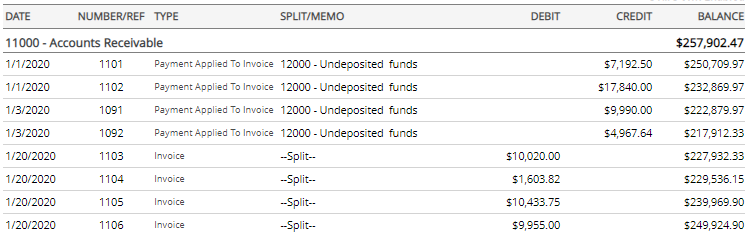
As you can see, the Cash Flow Monthly Statement provides you with an easy-to-read running total of changes in balance sheet accounts and income. These changes affect cash and cash equivalents, breaking the analysis down to operating, investing, and financing activities.
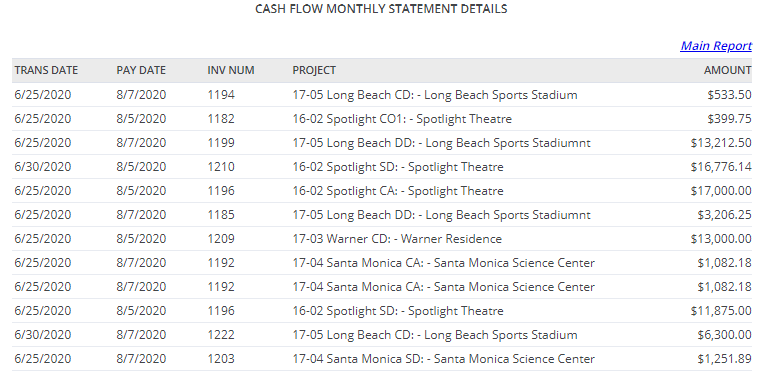
CORE also allows you to select a specific month on the report and “drill down” for more details. In this example, we drilled down into the month of June to list out the specific invoices and payments occurring within that month.
Cash Flow vs. Revenue
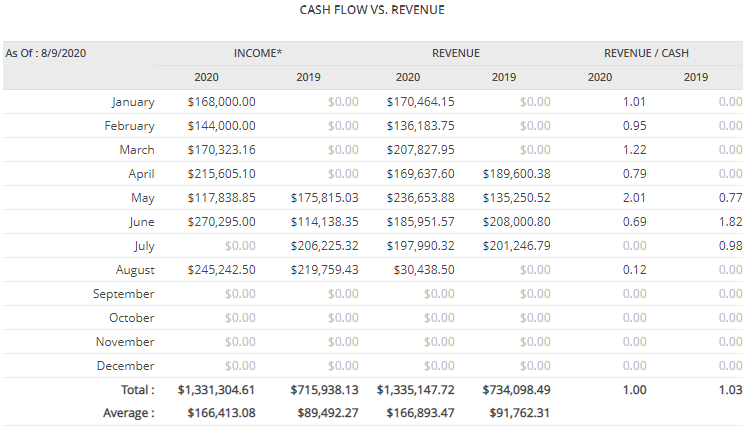
The Cash Flow vs. Revenue report takes things to the next level by contrasting the monthly income against the associated revenue (total amount of income generated by the sale of goods or services) by month. It also provides a benchmark total from the previous year for reference.
This report also includes a third column labeled Revenue/ Cash to help evaluate the difference between income and revenue per month.
Accounting Receivable with Aging
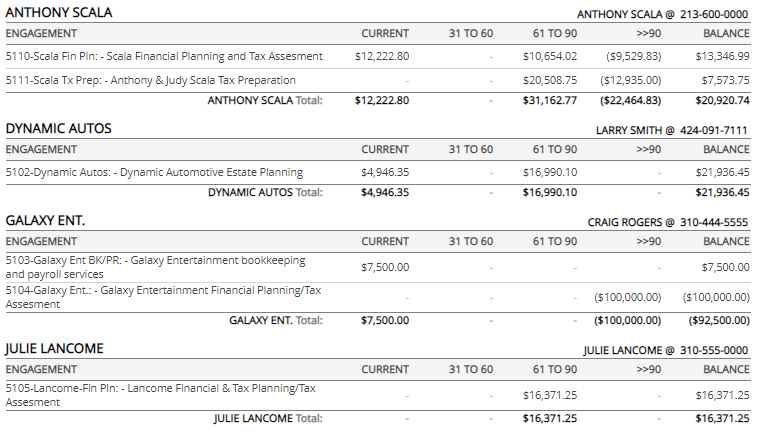
A standard way to see revenue is by running an Accounts Receivable report, which lists invoiced amounts and categorizes these totals into columns according to how long they have remained unpaid (aging). In this example, we sorted by Client and opted to limit the view to 90 days past due.
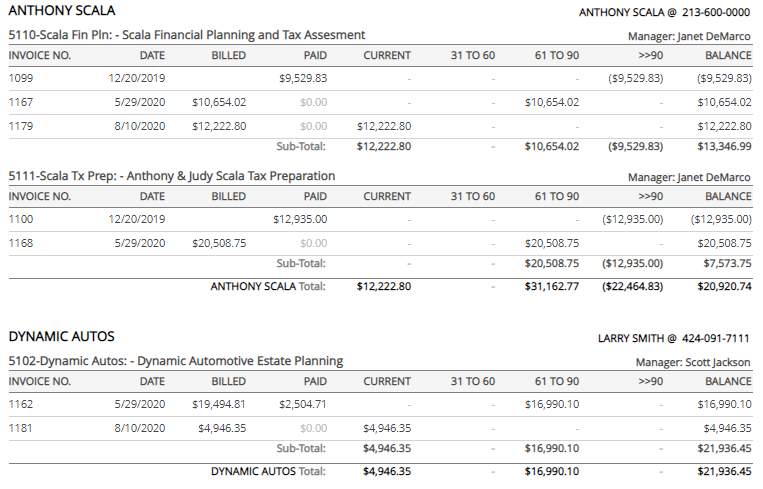
The Accounts Receivable report can also be run with details, which then lists the corresponding invoices, invoice dates, and payment details to provide clearer insight into which specific invoices remain outstanding.
This is one of the most frequently memorized and scheduled reports in CORE, as this level of financial overview directly translates to increased cash flow when properly managed.
Accounts Payable with Aging
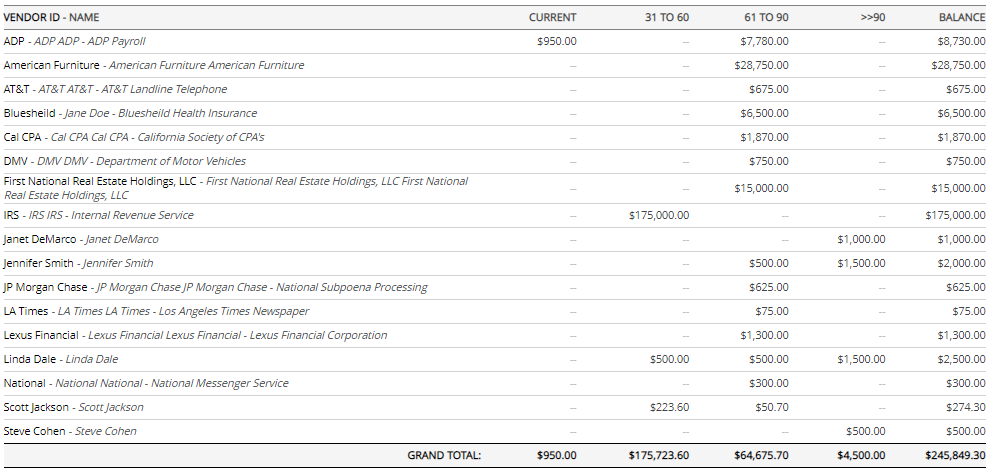
The Accounts Payable with Aging report provides a list of bills yet to be paid by your company. It can represent a large portion of the current liabilities on your balance sheet, as it includes unpaid Vendor Bills, general overhead expenses, and employee reimbursable expenses.
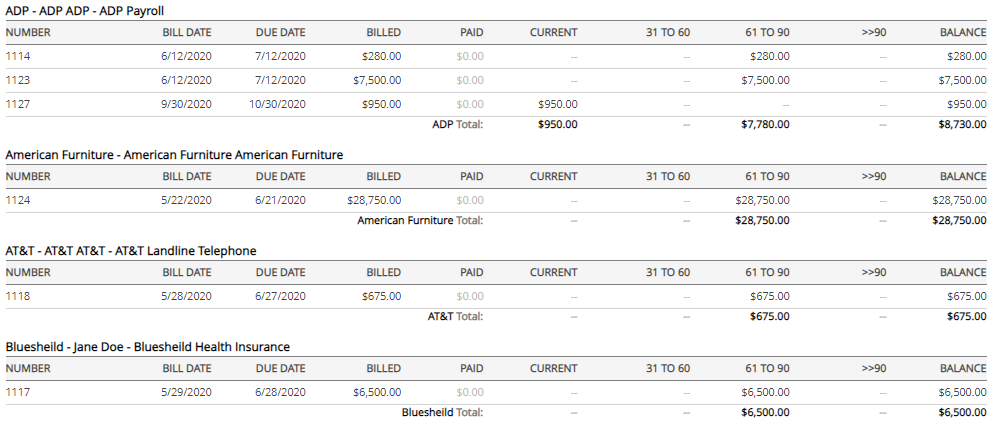
Running the report with the “show details” option provides itemized records for each outstanding line item.
Statement by Client (Accountant)
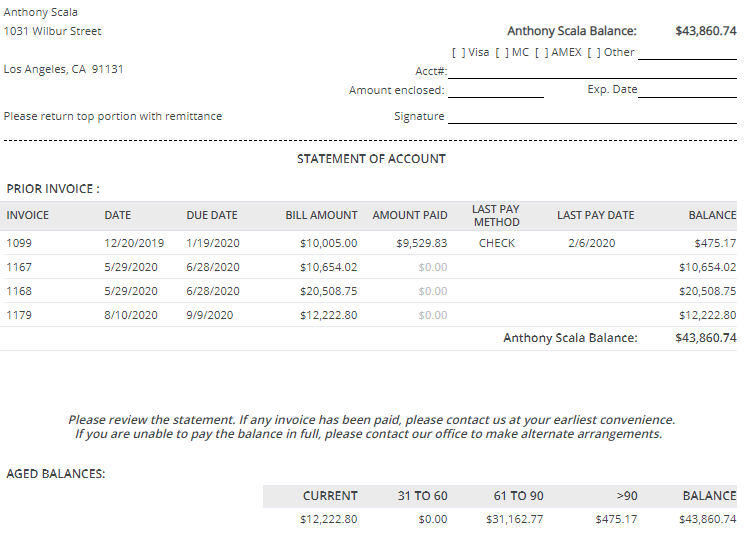
Another extremely useful tool for improving cash flow in CORE is the Statement by Client (Accountant) report. Consider scheduling this report to be delivered to important clients automatically so that they will always be aware of billed services and outstanding invoices.
If you prefer to receive payment via ePayment (Stripe account), then consider enabling these options in Global Settings. Once configured, invoices sent from CORE will include a link to provide payment through Stripe. You can now also receive ACH payments from your clients in CORE as well.
CORE can also handle various statement formats. Please check the Billing > Statements features in CORE for more details.
Company YTD Comparison
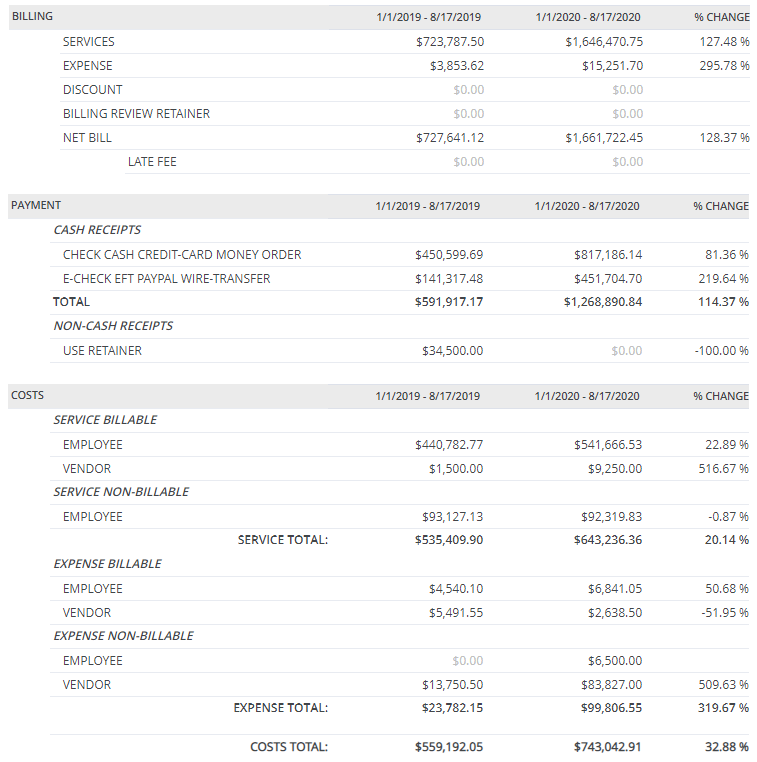
The Company YTD (year to date) Comparison report gathers key indicators for your current financial health and categorizes them into sections such as Billing, Payment, and Cost. These values are then contrasted with the previous year and represented with a percentage change for quick reference.
As you can see in the top Billing section of the example report, income from services and income from expenses are listed separately and then combined in the total for Net Bill. This allows the firm to readily understand the return on both employee activity and billable expenses.
Expand that same logic by category, and you can see why this report has become a go-to for so many.
Other Useful Accounting Reports in CORE
These reports are typically useful for understanding the overall health of your firm’s financials, as well as tracking expenditures vs. budgeted limits.
Be sure to check out the “End of Year” reports guide at the end of the article.
General Ledger
Trial Balance
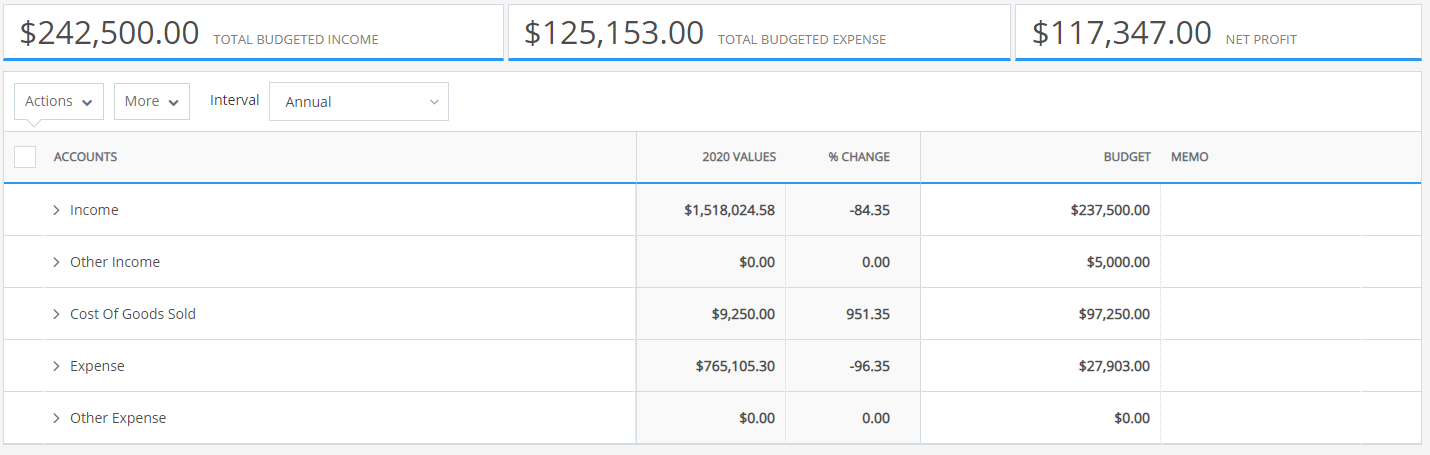
Financial Budgets

End of the Year Reports
Be sure to check the CORE Help Center for more information, including closing accounts at year end.