This report cheat-sheet breaks analysis down into several key areas:
General Project Review Reports
Creating projects in CORE can be simple. However, populating only the required fields does prevent you from benefiting from some of the most useful features in the project module.
We highly recommend utilizing phases level budgets, tailored billing options, project rules and assignments. You can also use project groups to help organization.
Some of the most frequently used reports to provide this clarity are:
1. Project List
The Project List report allows project managers to visualize which jobs they should have eyes on, current contract amounts, as well as project start and due dates.
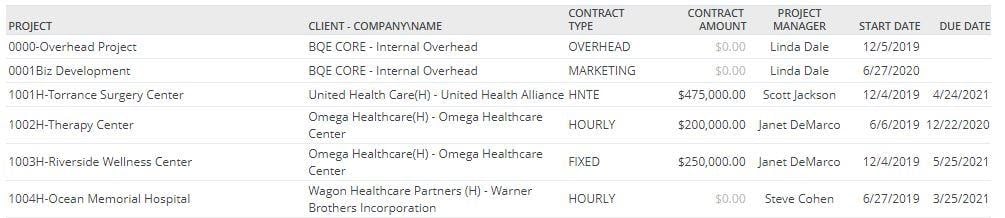
Value: This report will allow your management team to have a current list of active projects/phases, as well as due dates. Consider scheduling this report by project manager.
2. Project Status
The Project Status report simply lists the project, contract type/amount and the billable value of Time/Expense (Spent) to date.
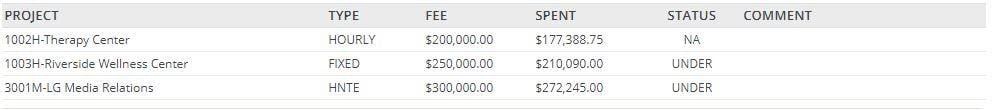
Value: Similar to the Project List report covered earlier, this Project Status report can also be used to highlight projects over/under contract amounts in relation to the value of billable services performed. [N/A represents no contract limit]
3. Contract Analysis
The Contract Analysis report provides a detailed comparison of project contract amounts vs service and expenses over a given period. It also provides estimated completion and actual percentages based on project progress.
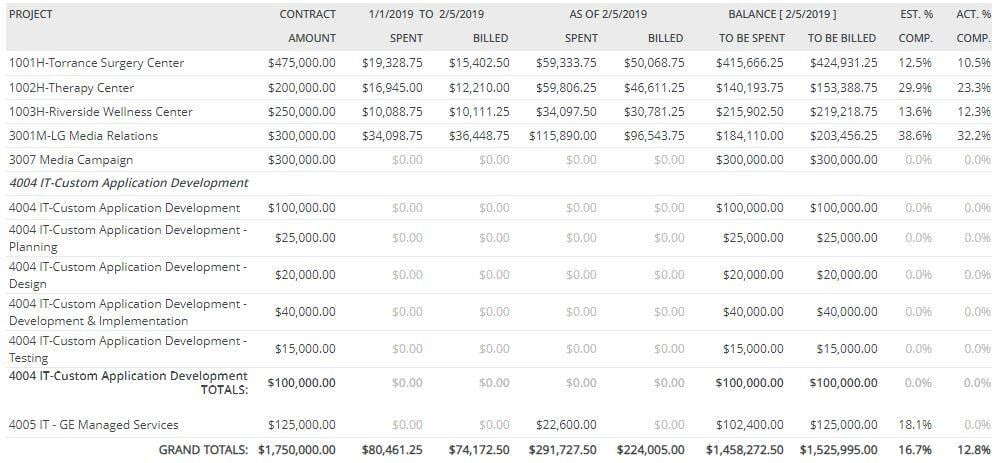
Value: This is a “heartbeat” type of report which can highlight project completion progress, and also features a work in progress “To Be Spent” column.
4. Budget Comparison
The Budget Comparison report provides an overview of actual time and expense entries logged against a project vs the estimated limits set by the current budget.
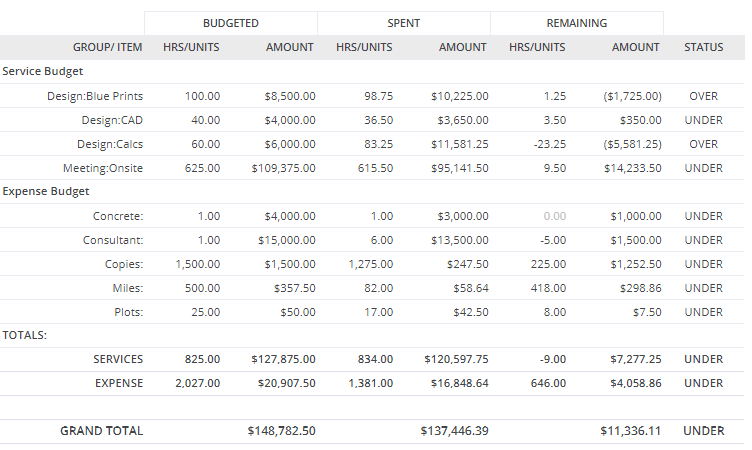
Value: Not only does this report help keep your team informed for remaining tasks, managers can also easily identify where budget overages occurred.
5. Due Projects
Do not be fooled by the simplicity of the Due Projects report. Being able to provide a snap-shot report to project managers to remind them and their teams of important deadline can be critical to preventing costly scope creep.
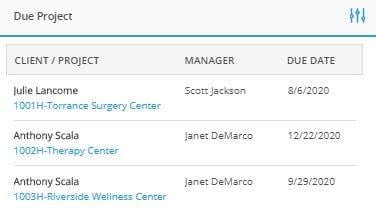
Value: Keep your team informed of these critical dates! Add this useful Dashboard Widget, and do not forget to use the filter to set date ranges and other settings.
Project Management & Time Tracking Reports
To be honest, every one of the reports on this article are technically “project management” related. The focus of this subsection is to provide guidance on setting project scope, employee schedules and then tracking actual progress made as time is logged to your projects.
1. Employee/Project Allocations
CORE provides a built-in GANTT chart component which can be used to set up and manage employee workload and schedules.
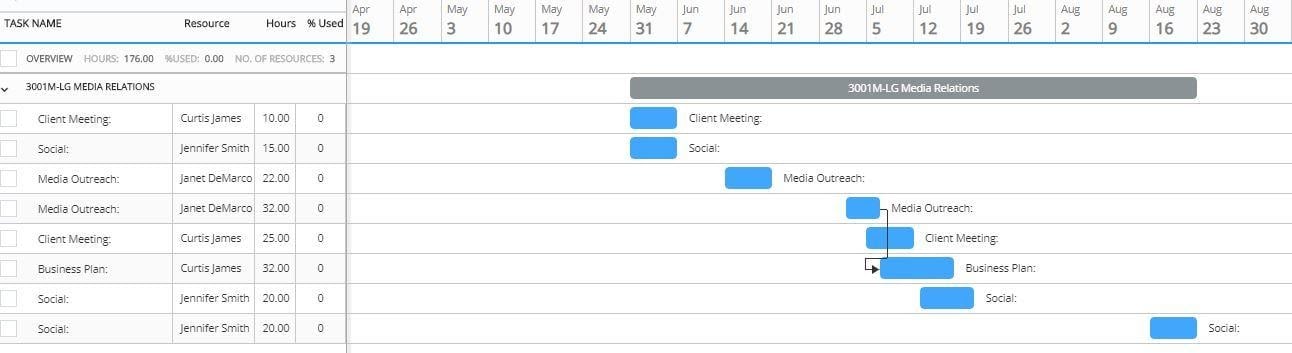
You can find the GANTT chart features under the Project > Allocation & Forecasting section of CORE, and is an excellent tool to help visualize employee workloads.
It can also provide information on revenue forecasting based on expected billable value of time to be performed.
Once you have successfully configured employee tasks and dates, you can run either the Employee or Project based Allocations reports to display a list of time scheduled as well as completed vs remaining hours.
NOTE: Employees may also want to add Dashboard widgets to see assigned hours
Value: CORE’s Allocation & Forecasting features bring employee scheduling to the forefront. Your team will now be able to see pending vs completed tasks. Managers will also be able to see the billable value of the scheduled time. Use the built-in GANTT chart for visual tracking of project scope completion.
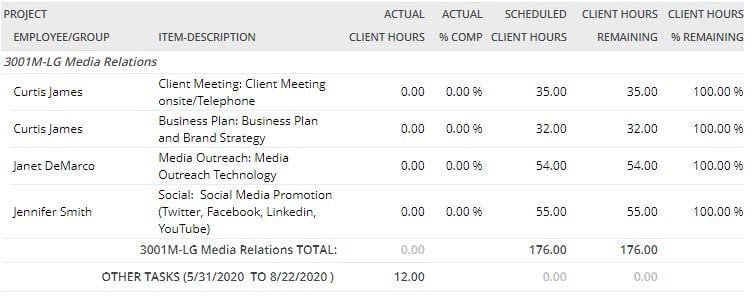
2. Allocated VS Earned Revenue with Forecast
Once task hours have been allocated to employees/groups, try running this summary report to show both task progress and forecasted income.
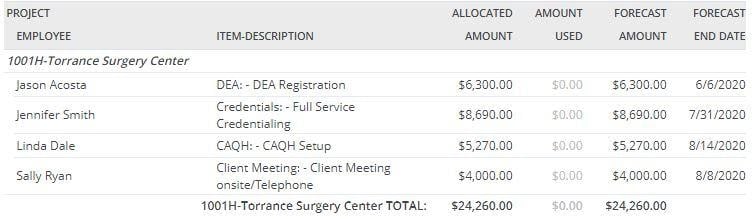
Value: This easy to read report displays the expected revenue for assigned tasks over a given period of time. Even if you bill fixed fee, your management team can now confidently compare set contract amounts vs the value of expected services.
3. To-Do Tasks
(Filtered by Type “Project” and ordered by Priority)
Whether or not you decide to use the full-featured allocations options listed above, you still may benefit from creating reminders for employees to help provide a working list of outstanding tasks to complete.
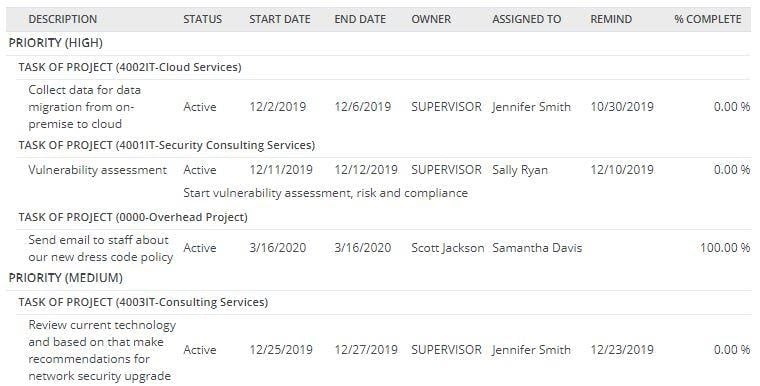
Value: These To-Do entries may not be as detailed as allocations; however, the extra benefit here is that a completed To-Do can be automatically converted into a time entry.
4. Time Entries Graph
The value of the Time Entries Graph report is that it will visually break down the hours spent on a project by activity, without having to read through a detailed list of time records.
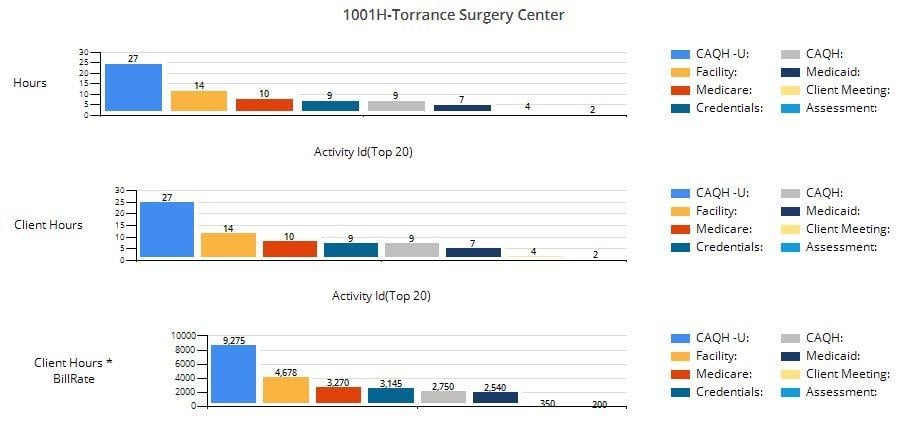
Value: Save time on project review. Rather than scrolling through lists of time entries, use this graph report to display hours spent on a project by activity.
Expense Tracking Reports
Tracking Vendor Bills & Employee Expenses
Vendor Bills
Use the Vendor Bills report to list existing bills over a specified period.
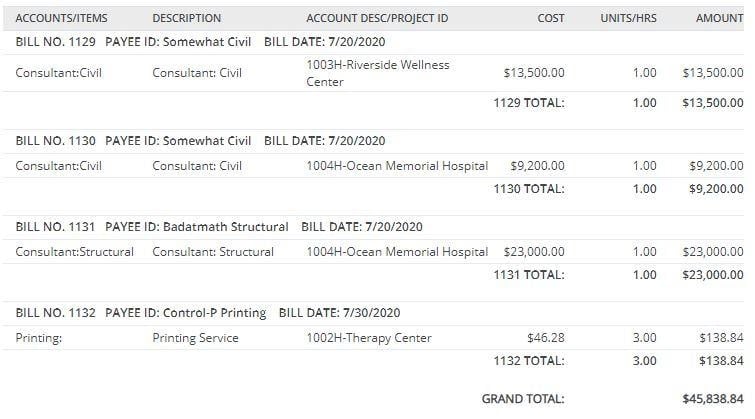
Pro Tip: You can also obtain a quick list of outstanding (unpaid) Vendor Bills by setting a filter by “payments status: unpaid” on the Payables > Vendor Bills screen.
Value: This report can be scheduled to provide a clear list of bills to pay on time
2. Project Expenses Graph
While you certainly could generate a list of expense entries, consider using the time-saving Project Expenses Graph report to help visualize project expenses.
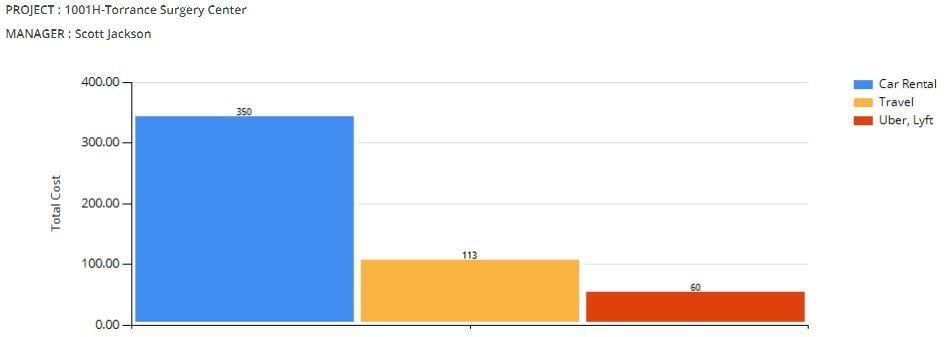
Value: The visual format of this report helps reduce the time required to review expenses, yet still provides the total costs and breaks out by expense type.
3. Project Expenses
If you would rather see a list of expenses, either detailed or summarized, this Project Expenses report will provide you with information on cost, reimbursable status as well as mark-up value and the amount of tax applied.
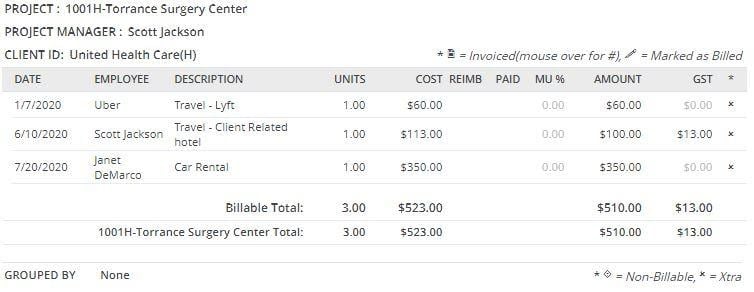
Value: This report lists out expenses in details, and automatically sorts the entries by project for easy review. The report also denotes important status flags; such as whether the expense entry is reimbursable back to the employee, if it has been paid, and/or billed.
Invoicing & Revenue Collection Reports
1. Project Manager Billing Review
Use the Project Manager Billing Review report to list existing project invoices, payments received as well as credits/write-off amounts applied.
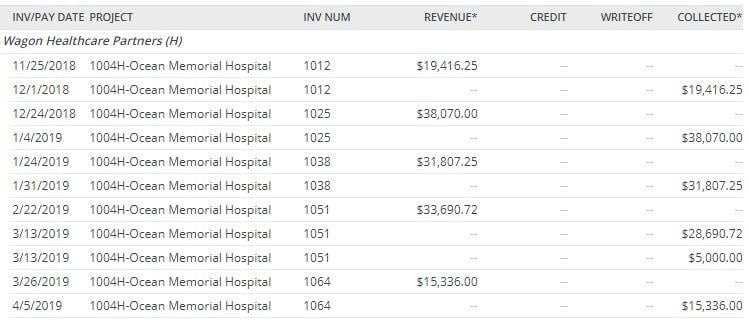
Value: This report can be run directly from the main Project screen, under More > View Reports. It provides a list of invoices per project, as well as billed value and payments received.
2. Percentage Billed
If you are more interested in viewing a summary of billed vs contract values, then consider running the Percentage Billed report.
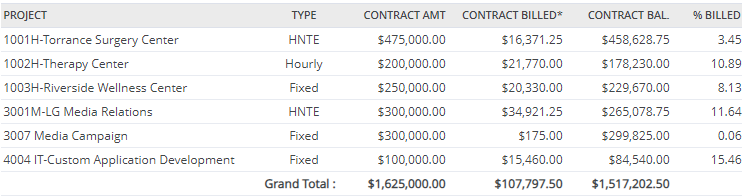
Value: This concise report gives project managers a quick overview of billed amounts vs contract values, work remaining as well as percentage billed. Scheduling this report on a monthly basis, by project manager, can really help keep both job captains and the billing team aware of how much work is in the pipeline.
3. Project Account Transaction Details
Another useful billing report is the Project Account Transaction Details report. It includes invoice details, payment date/method, as well as any retainer use.
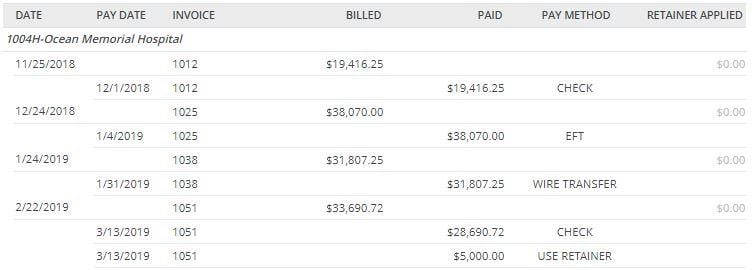
Value: While there are many billing minded reports in CORE, this Project Account Transaction Details report is extremely useful for tracking the application of project retainers.
Note that “retainer applied” refers to income that was originally received (often in advance) as unearned income, and has now been applied to an invoice as earned income.
Job Costing Reports
1. Project Performance
The Project Performance report provides a summary of project cost vs billable amounts, as well as the billable value of remaining (unbilled) services/expenses.
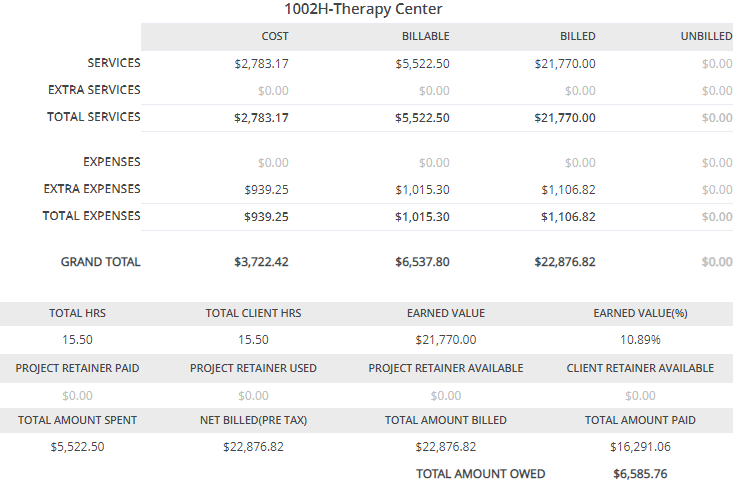
For example: This Therapy Center project has a fixed contract amount of $200,000 and has billed $22,876.82 to date. In addition to showing the fixed fee billing amount, this report also shows the earned value of billed services $21,770.00 which is (10.89%) of the contract value, with a total of $3,722.42 in cost to date.
Value: Project managers can review the health and profitability of a project summarized into one easy report.
2. Cost Analysis
The Project Performance report provides a summary of project cost vs billable amounts, as well as the billable value of remaining (unbilled) services/expenses.
Value: This easy to ready report allows you to gain a quick understanding of billed time and expense value vs cost, as well as overall project completion.
3. Project Time & Expense (Summarized)
If you are looking for a snap-shot report listing out project hours and expense cost totals, look no further than this handy report. Use “Options” to hide details.
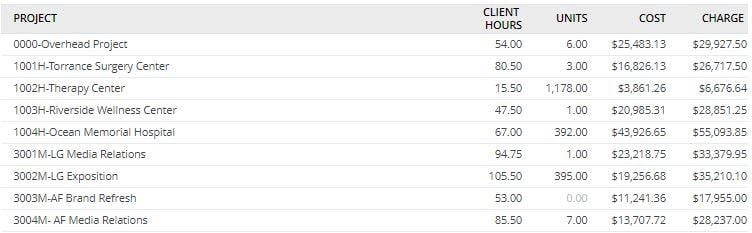
Value: This a very flexible report which can be filtered to show costs by employee, project, groups and/or date ranges. It is based directly on the burdened cost value of time and expense entered into the system, so it is critical to verify that employee rates and overhead multipliers are configured correctly.
Document and Information Tracking
1. Documents
CORE can help you store and organize project documents. Use the Documents report to quickly list relevant files and details for easy reference.
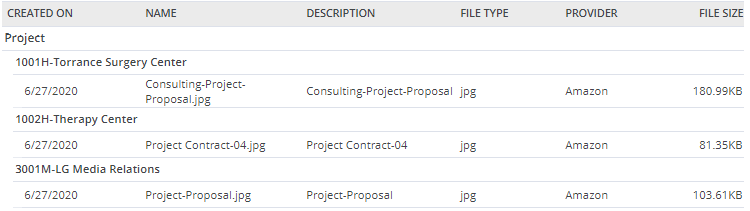
Value: Centralizing project proposals, images, spreadsheet and other similar documents in the cloud can turn the nightmare of storage and version tracking into a breeze.
2. Project Notes
Below is an example of a project note displayed by the Project Notes report.
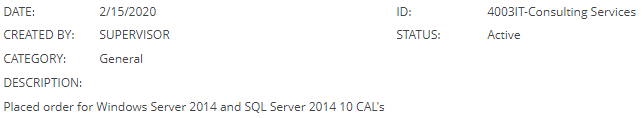
Value: The Project Notes report provides a convenient date driven list of important project information, such as changes to contract amounts, purchase orders and more.
3. Submittals, Drawings and Requests for Information (RFI’s)
Similar to the reports for documents and project notes, CORE includes the ability to track and display a list and current statuses for time sensitive documents.
The reports are not shown here, as they reflect the reports already shown above.
Financial/Employee Analysis
1. Earned Value
The Earned Value report compares the billable value of budgeted time vs the estimated billable value of completed tasks.
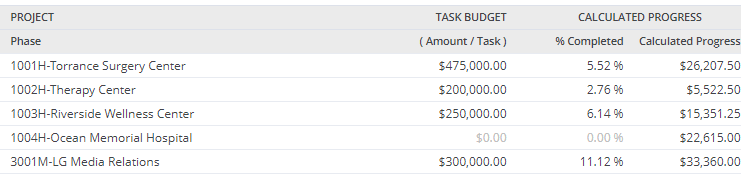
Value: This report is a great option to use when you need to see not only estimated project progress, but also how much can be billed against a set contract.
2. Employee Realization Rate
Use this report to compare hours worked vs the value of billed (realized) time.
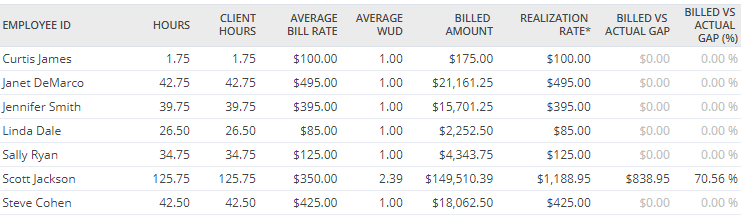
Value: While it is certainly important to analyze projects and financials, consider using CORE’s employee level reports to gain a better understanding of employee performance, and the value of time billed with a write-up/write-down (WUD).
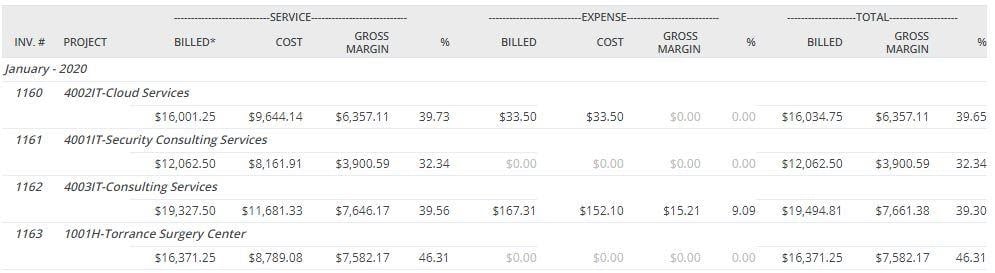
3. Project Profitability
Provides comprehensive information about gross project profitability within a specified date range.
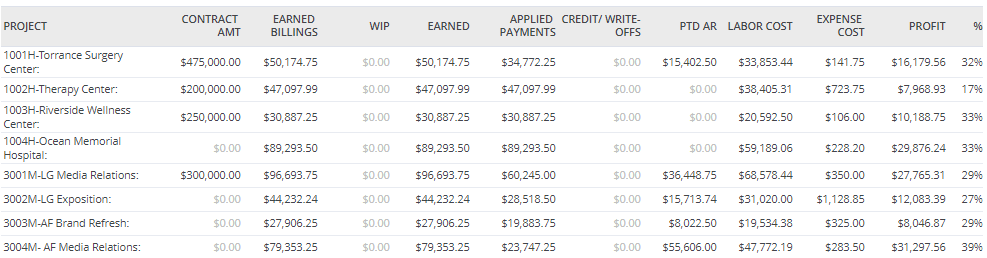
Value: This multifaceted report is not only great at providing a clear profit percentage, it also enables project review of earned value, unbilled time (WIP), payments and other key performance indicators. It also includes cost based review.
4. Monthly Revenue by Project
Provides a graphical representation of project revenue by month, obviously.
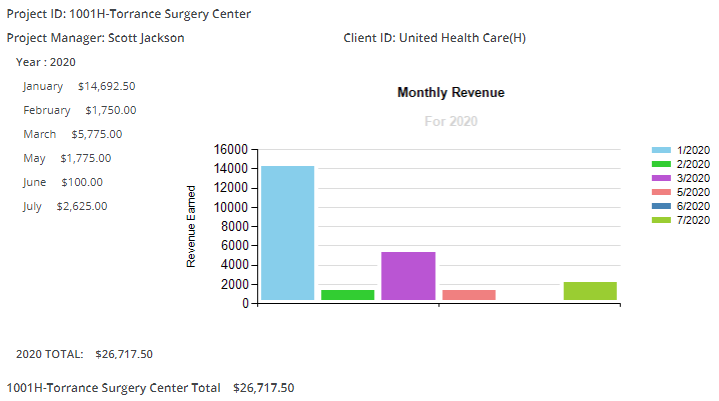
Value: The power of visuals cannot be understated. Bring this Monthly Review report to your next planning meeting to help emphasize key projects to optimize office efforts.
Tips to Help Organize Projects for more Streamlined Reporting
1. Project Groups
Use Project Groups to associate projects and phases together. You set up the categories, and each project/phase can be assigned to an unlimited number of groups.
Examples of Project Groups include: Residential, Commercial, Not-for-Profit, By Region/Office, etc.
Once configured, groups can be used on various filters within CORE.
Look for groups on the main menu under Productivity Tools > Groups
2. Classes
Use Classes to categorize project financial reports
A class allows you to track project income or performance by partner, location or any other parameter at the project level. For instance, if you keep data from multiple locations in one company file, you may assign a ‘class’ to each location to facilitate pulling together similar items for reporting.
Each project/phase in CORE can be associated with a class, and is set on the Project’s Billing Options screen.
Once configured, Classes provide categorization on financial reports.
Look for Classes on the main menu under Lists > Other > Classes
3. Custom Fields
The Custom Fields screen is where you can create customized fields to track data. While CORE provides a vast array of fields to use, you can add more fields as needed.
For example: We provide a Purchase Order field at the project level to track PO numbers, however you may also need to track a secondary tracking number.
To resolve this issue, simply open a project/phase and navigate to the Custom Fields tab. Create the field, select the appropriate type and provide a name. Now all projects will have the ability to record this additional content.
Custom Fields can also be used to drive filters and reports.
Look for Custom Fields on the main menu under Lists > Custom Fields
4. Custom Reports
While CORE comes default with an extensive list of reports, you may find it advantageous to either customize a report view to include/omit data, or even combine multiple reports into a more summarized view.
If you are interested in ordering a customized report, please contact customreports@bqe.com with a detailed request and report mock-up if possible.
5. Dashboards
The Dashboard is the default home page and is unique to each user log in. Each Dashboard contains a series of visual widgets that provide information from your company database and present it in the best format on different panels. You can have or add a maximum of 9 widgets on a dashboard, but you can add unlimited number of dashboards. Although most of the widgets display information for the last 12 months by default, you can choose any specific or custom data range. You can even display the same widget twice for two different date ranges for comparison and rename them to reflect different views.
Be sure to utilize these powerful tools in addition to running basic reports!
6. Scheduled Reports
One of my favorite features in CORE is the ability to program nearly any report to run automatically on a schedule and is then delivered via email to specified recipients.
For example: You can create multiple versions of a Project Performance report, and set the filters to a specific project manager. Then simply set the schedule options and provide an email address. That manager will now get a review of their projects via email according to the schedule you set. Repeat per relevant manager.
Scheduled reports can also be edited later to adjust date specific parameters.