As an engineering team one of your main goals is to hone your craft and deliver amazing results. It’s your main drive day to day. While doing this, you’re creating projects at an increasing deployment frequency, bridging the gap between traditional engineering and new innovative designs. Yet, how do you set yourself apart from competitors and know if your hard work is actually helping you reach your goals? This is where Key Performance Indicators, or KPIs, come in.
Amidst your many pull requests and construction drafts, KPIs are more than just terms and story points circulated during scrum meetings. They are basically a guide for your team to ensure each project is a success for the entire firm. By tracking these crucial indicators, you can assess a project’s current performance, estimate its lead time for changes, and even determine its post incident mean time to recovery (MTTR).
KPIs illuminate your firm’s strengths, count the number of bugs or defects, and indicate if the development process is veering off its planned course. By harnessing KPIs, you can ensure your projects not only function seamlessly but bring in a stronger ROI.
What are KPIs?
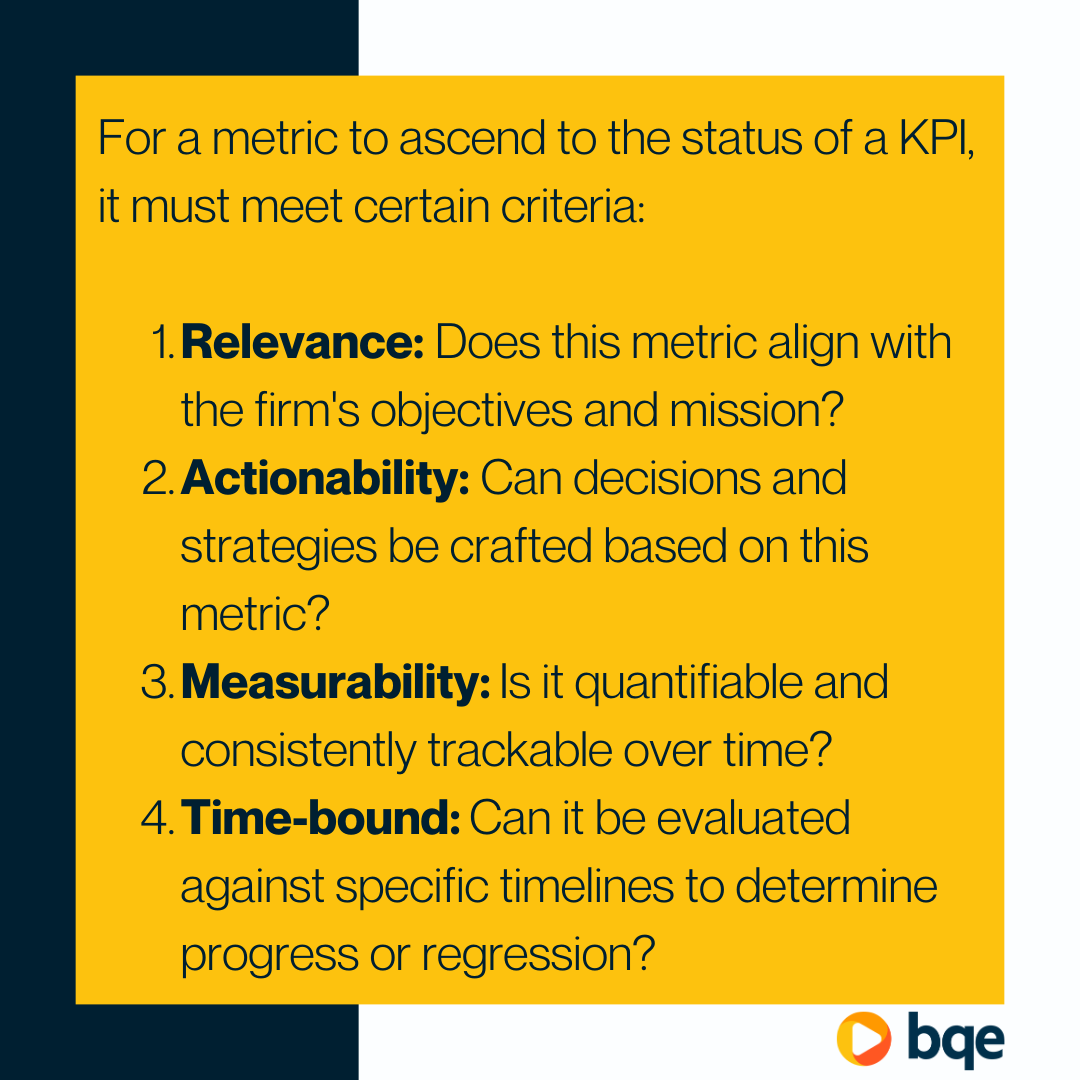
Key Performance Indicators (KPIs) are specific metrics used to evaluate your firm’s success in meeting its key objectives.
KPIs should be thought of as strategic instruments that can be crafted to offer insights and guide decision-making in your team. They provide a full view of your firm’s health, highlighting areas of excellence and flagging potential pitfalls. They also provide foresight, allowing your engineering managers to adjust their strategies, realign their resources, and make informed decisions.
KPIs vs Metrics: Understanding the Difference
KPIs and metrics are often confused with each other, but they are both used differently in your firm.
Engineering metrics are the raw data or numbers reflecting certain aspects of your firm. For instance, certain metrics might inform you about the engineering costs of various projects, a project’s time to market, how many iterations were required before finalizing a design, the number of projects completed this quarter, or the number of new clients acquired. However, not all metrics hold the same weight or importance.
A KPI is a carefully chosen metric that creates an actionable insight. You can use it to guide the way on your projects, signaling what's truly important for your firm’s overall success.
Top 10 KPIs for Engineering Firms
Project Profitability
As an engineer, you’re all too familiar with how important it is to know the financial viability of each project. That’s why the Project Profitability KPI is one of the top KPIs your firm needs to track. Project Profitability is the measure of the profit your firm makes from a project after all costs have been subtracted.
To figure out this KPI, you can calculate it by the following:
Subtract total expenses from your total project revenue. Then divide that figure by your total project revenue.
Analyzing the project profitability KPI means you can assess the financial health of your firm and make informed decisions about resource allocation, pricing strategies, and more.
Tracking Project Profitability
BQE CORE, with its specialized project accounting features, offers a seamless way to track project profitability by centralizing all project-related financial data, from initial estimates to expenses incurred. Real-time insights into project revenue and costs empower engineering firms to accurately calculate profitability metrics.
Plus, its intuitive and agile dashboards and detailed reports make it easier for firms to visualize the financial performance of individual projects. With such in-depth analysis at their fingertips, firms can assess the success of current ventures and derive actionable insights to optimize profitability for future projects.
Utilization Rate
So how effectively are you using your firm’s resources? This is where the Utilization Rate can offer beneficial insights. You may be surprised by resources you’re paying for but not even using to their full potential!
The Utilization Rate is the ratio of billable hours to the total available hours. It shows how much of your firm's revenue is being used for projects that actually generate revenue.
For the following formula, we’re going to say your team has acquired 350 billable hours for the quarter.
To calculate the Utilization Rate, you divide the total billable hours (350) by the total available hours (480 x 3 = 1,440) and multiply the result by 100 to express it as a percentage:
Utilization Rate = (Total Billable Hours / Total Available Hours) x 100 Utilization Rate = (350 / 1440) x 100 Utilization Rate = 24.31%
Utilization rate is important to track since resources that aren't utilized efficiently can lead to missed opportunities and reduced profitability.
Tracking Utilization Rate
BQE CORE provides a full view of your firm's resource utilization. The platform's time-tracking features, integrated with project management tools, make it straightforward to differentiate between billable and non-billable hours. Your firm can see in real-time the proportion of time your team spends on revenue-generating tasks versus other activities.
BQE CORE's reporting capabilities allow for a breakdown of utilization rates, distinguishing between individual engineers, teams, or even specific equipment. This not only helps in identifying bottlenecks or under-utilized assets but also facilitates proactive resource allocation and helps achieve organizational goals.
Client Satisfaction Score
This is an important KPI that is often overlooked in engineering firms. Without satisfied customers, your firm doesn’t stand much of a chance of succeeding, so it’s important that you analyze this KPI carefully.
Client Satisfaction Score (CSAT) typically comes from a single, straightforward question posed to clients: "How satisfied are you with our service?" The respondents will rate their satisfaction on a scale, usually ranging from 1 (very dissatisfied) to 5 (very satisfied). The average of these responses yields the CSAT score, often represented as a percentage.
Positive feedback can steer potential clients towards your firm, while constructive criticism can help guide refinements and innovations.
Tracking Client Satisfaction Score
Once a project is completed or reaches a significant milestone, BQE CORE can automate the process of sending out satisfaction surveys to clients. The responses are then aggregated within the platform, allowing you to easily calculate the overall CSAT score and view it alongside other critical project metrics.
The platform provides visualization tools, assisting you in identifying trends in client feedback over time. Whether there's a particular aspect of service that consistently shines or an area where clients are voicing concerns, BQE CORE offers the data-driven insights necessary for you to act promptly.
Project Completion Rate (On-time Delivery)
The Project Completion Rate is the ratio of projects completed on or before the promised deadline to the total number of projects undertaken. It’s a clear indicator of your firm’s reliability and efficiency.
Deadlines should be thought of as commitments. They’re symbolic of your firm's dedication and professionalism. Delays and overruns don't just escalate costs; they can dent your firm’s reputation, destroy trust, and even jeopardize future opportunities. A strong on-time delivery rate amplifies your engineering firm's credibility and makes happy clients not only come to you again, but also recommend you to others.
Tracking Project Completion Rate
BQE CORE allows firms to set and track milestones, get real-time updates on project progress, and receive alerts for any potential delays.
One of the standout features of BQE CORE is its interactive Gantt chart visualization. With this, firms can get an immediate sense of project timelines, identify dependencies, and proactively manage resources to adhere to deadlines. If there's a risk of delay, the platform's alert system prompts timely interventions, ensuring corrective actions are taken before a deadline is missed.
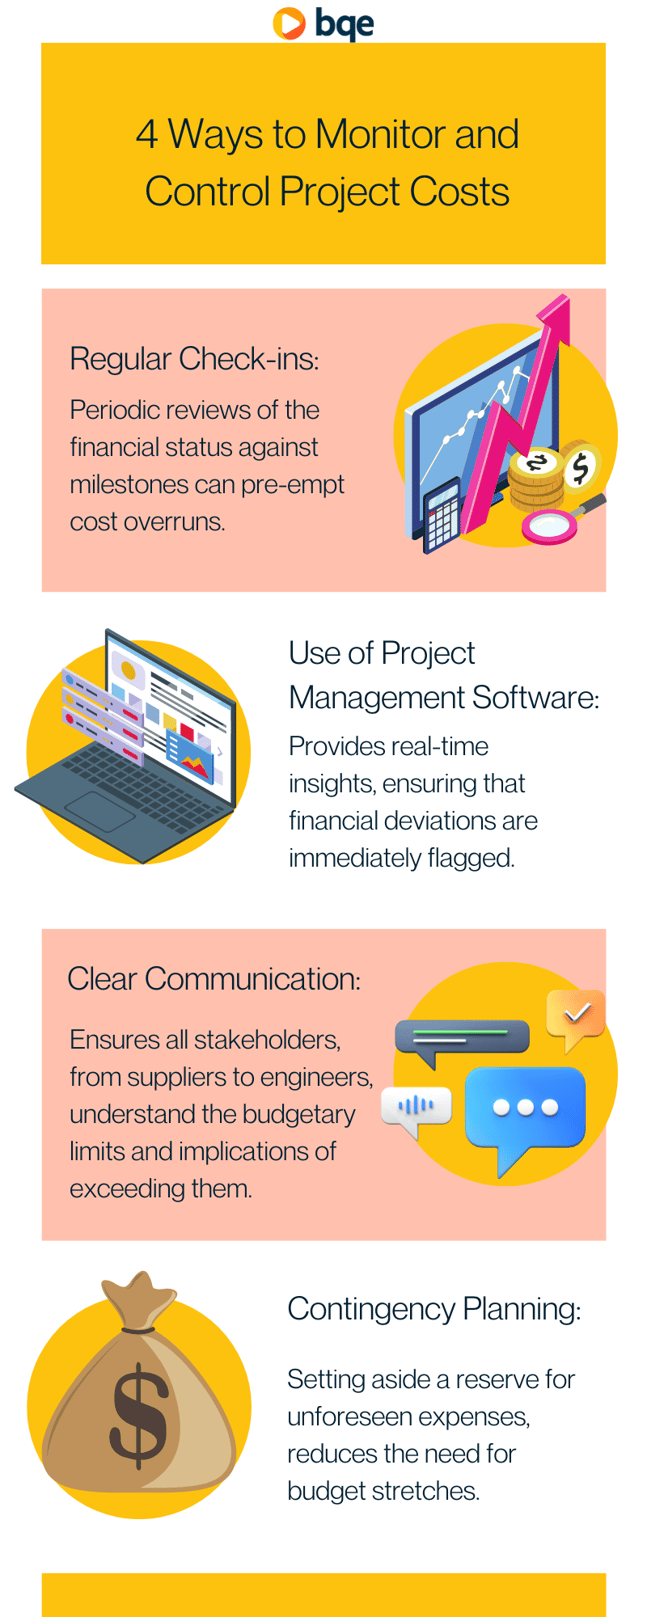
Budget Adherence
Budget Adherence measures how closely your actual project expenditures align with your projected budgets. Staying within budget parameters shows that your firm has prudent management, foresight, and respect for financial commitments.
Tracking Budget Adherence
As a project progresses, BQE CORE continually tracks expenses, comparing real-time expenditure against the stipulated budget. This comparison is displayed in easy-to-read charts and graphs, providing your firm with a clear picture of their financial position at any given moment.
In cases where expenditures approach or exceed the budgeted amount, BQE CORE sends out automated alerts. This proactive approach ensures that budget overruns are addressed promptly, allowing for necessary adjustments or client communications to be initiated in a timely manner.
Through comprehensive financial reporting, your firm can also assess their historical budget adherence performance, identifying areas of strength and opportunities for improvement.
Employee Turnover Rate
This is an interesting KPI to track, but one that we consider to be very valuable for any engineering firm. As you know,your firm’s strength doesn't just lie in its tools and software, but also in its people. The Employee Turnover Rate is a crucial indicator of the health of your team. Without your team, you don’t have much of a firm. And what firm has time to stop and hire new talent all the time?
If you have high employee turnover, this can destabilize project continuity, leading to potential delays. Plus, a high turnover can impact morale and potentially tarnish your firm's reputation. Keep a close eye on your turnover rate. It’s that important.
Tracking Employee Turnover
BQE CORE centralizes employee data, allowing your firm to keep track of hirings, departures, and tenure. With a few clicks, you can generate reports detailing turnover rates over specified periods, helping pinpoint patterns or anomalies.
BQE CORE's integrated feedback and survey tools can be used to gather employee sentiment. Periodic feedback collection can shed light on potential concerns or areas of dissatisfaction, enabling proactive interventions to retain talent.
Net Multiplier
Direct labor is an investment, and the net multiplier KPI is a measure of your return on this investment. It shows you how many dollars of revenue your firm generates for every dollar you spend on direct labor and measures your actual performance.
To calculate net multiplier, follow this equation:
Net Multiplier = Net Operating Revenue / Total Direct Labor
The net multiplier is a good way to get a deeper look at your firm’s financial health. Your net operating revenue should be greater than total direct labor. If total direct labor is greater than net operating revenue, you should investigate why your costs are so high.
Tracking Net Multiplier
BQE CORE’s reporting features let you create custom reports that help you track and analyze the Net Multiplier. You can easily create a custom report that includes fields for net revenue and direct labor cost and then calculate the net multiplier within the report. Once these reports are set up, you should analyze the results on a regular basis to monitor performance. BQE CORE’s real-time dashboards give you an immediate snapshot of the Net Multiplier KPI for a quick overview anytime you need it.
Return on Investment (ROI) for Projects
ROI measures the profitability of a project relative to its cost. ROI doesn't just reflect your project's profitability; it also shows the value of the initial investment. A high ROI indicates that a project has not only covered its costs but has also generated substantial value for your firm. This allows potential investors, stakeholders, and even clients to see your firm’s financial success.
The basic formula for ROI is (gain from investment - cost of investment) / (cost of investment). When you multiply that number by 100, you'll get it as a percentage.
Tracking ROI
With BQE CORE, you can easily input the initial investments for projects, covering everything from labor costs to material expenses. As the project advances, BQE CORE actively tracks incoming revenues against these costs, auto-calculating the ROI in real-time.
Its dashboard visualizations present the ROI data in a user-friendly manner, allowing you to quickly grasp the profitability of ongoing projects. This becomes invaluable during stakeholder meetings or client reviews, as it provides an immediate snapshot of the project's financial health.
Bid to Win Ratio
This ratio, which compares the number of projects bid to the number actually won, offers clear insight into your firm's market competitiveness. A higher ratio signifies that your firm's proposals are resonating with clients, indicating a strong presence in market positioning.
To do this you would divide the number of bids your firm wins by the number of times your bids were rejected. If your firm wins twenty-five new projects but loses fifty, your bid-to-win ratio is 50%.
Tracking the Bid to Win Ratio
When tracking with BQE CORE, every proposal and bid submitted by your firm is documented within the platform. Once a project's status is updated – be it won, lost, or pending – BQE CORE dynamically calculates the Bid to Win Ratio, offering a real-time perspective on your firm's market traction.
The platform's visualization tools bring this ratio to life, presenting it in easily digestible charts and graphs. This allows decision-makers to instantly gauge how well your firm's propositions are aligning with client expectations.
Aged Accounts Receivable
The aged accounts receivable KPI shows your unpaid client invoices and unused credit memos by date ranges.
This is a valuable KPI when trying to determine which invoices are overdue for payment. Calculating your average aged accounts receivable shows you the average number of days it takes to get paid from the invoice date.
To calculate your aged accounts receivable, use the following formula:
Aged Accounts Receivable = Annual Average Accounts Receivable / (Net Operating Revenue / 365 Days)
You should do your best to collect all outstanding invoices within 30 days of the invoice date. If your average aged accounts receivable is greater than 30 days, it might be a signal that it’s time to reexamine your invoicing process.
Tracking Aged Accounts Receivable
BQE CORE lets you maintain detailed records of all invoicing and payment transactions, offering insights into the outstanding receivables segmented into different aging brackets such as 30, 60, 90 days, or even custom periods. By leveraging BQE CORE’s automated alert systems, your firm can receive timely notifications about overdue payments, helping to manage cash flows more effectively.
Implementing KPIs Effectively: Best Practices
Here are the best practices to ensure that KPIs provide the right data-driven decisions for engineering firms:
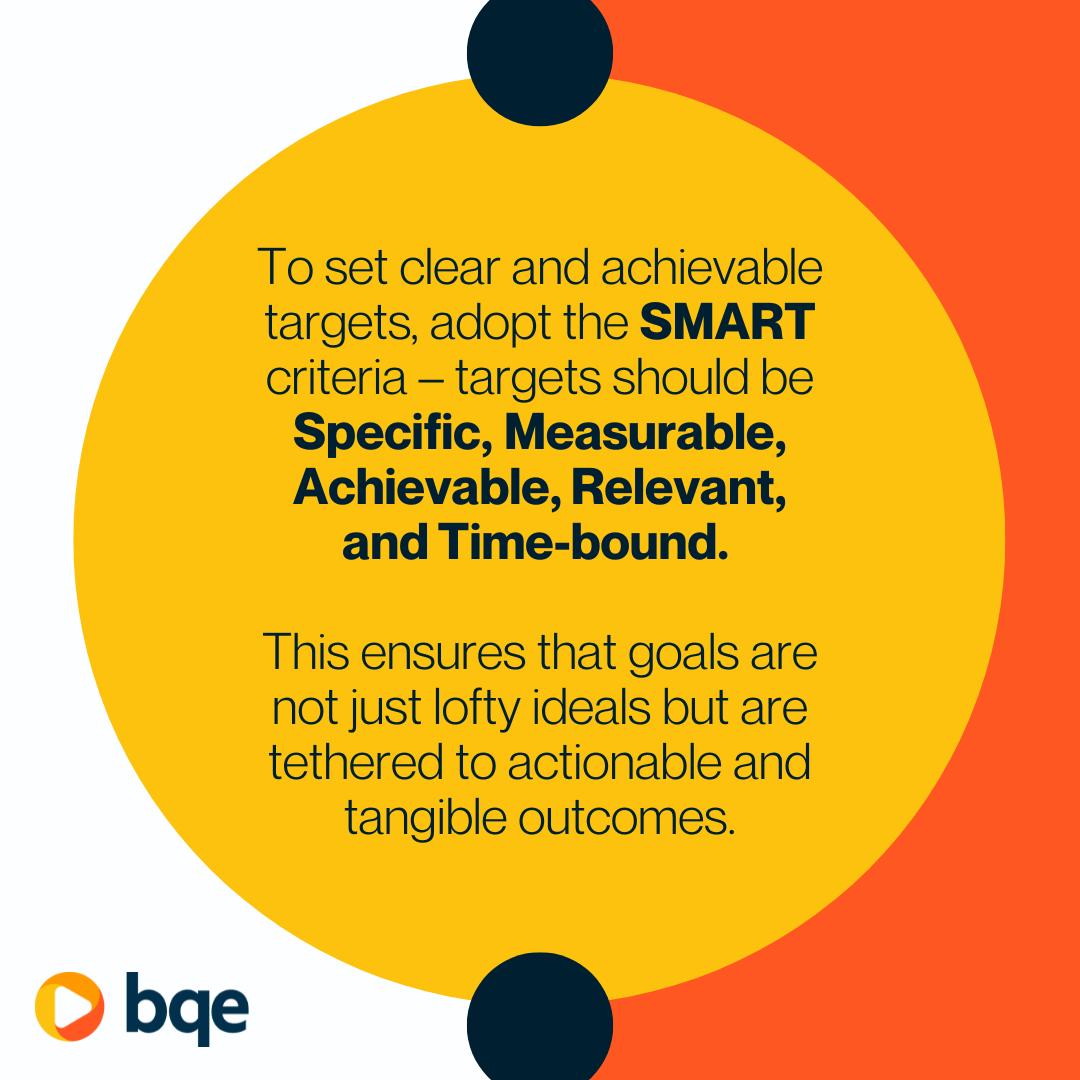
Set Clear and Achievable Targets
Setting a KPI without a clear target is like charting a ship's course without a destination. Targets should be both aspirational and grounded in reality.
Regularly Review and Update KPIs
Schedule regular KPI reviews, ideally quarterly. Your firm’s objectives are always changing, so it makes sense that your KPIs will change as well. What was important to track last year might not be as important as this year. Or you might need a completely new KPI to help you reach this year’s new goal.
Ensure That the Entire Team Understands and Is Aligned with KPI Goals
A KPI isn't a solo act; it's a collective endeavor. Its success hinges on every team member playing their part to perfection.
Regularly communicate the significance, objectives, and progress of KPIs to your entire development team. Workshops, team meetings, and training sessions can be valuable for this. When every team member understands their role in the bigger picture, they're not just working; they're contributing to a shared vision.
Benefits of Using Specialized Software for KPI Tracking
Efficiency and Accuracy
Manual tracking can be exhaustive and takes up a large amount of time while being prone to errors. Software engineering solutions automate the process, ensuring data integrity and real-time insights while also meaning you never have to waste time shifting through spreadsheets again.
Customization
Specialized software allows firms to tailor their KPI dashboards, aligning with specific goals and industry standards.
Data Integration
These tools often allow for integration with other enterprise systems, providing a holistic view and facilitating cross-functional analysis.
Predictive Analytics
Advanced software doesn't just record; it predicts. By analyzing trends, it can provide foresight, helping firms stay a step ahead.
KPIs to Track for Maximum Project Profitability
KPIs are the lifeblood of engineering firms. They aren't just numbers on a dashboard; they're narratives, telling tales of triumphs, lessons, aspirations, and growth trajectories.
It's not just about setting KPIs, but nurturing them, allowing them to evolve in tandem with the dynamic tapestry of the engineering world. As the markets shift and technologies transform, these KPIs must be revisited, recalibrated, and realigned.
To all the engineering leaders out there, remember: A skyscraper's strength isn't just in its beams and columns, but in the constant vigilance of its team. Similarly, the strength of your firm isn't just in projects and innovations, but in the regular monitoring and adaptation of your KPIs.
Ready to learn even more about tracking KPIs? Watch our on-demand webinar, “10 KPIs Your A/E Firm Needs to Track for Maximum Project Profitability.”