Financial Management
How to Use Financial Budgets in BQE CORE
Track your financial budgets with BQE CORE so that you can share data critical to the success of your company.
Companies can rely on BQE CORE's dashboards and reports to efficiently track and analyze 8 of the most important key performance indicators.
When it comes to driving success within your company, monitoring key performance indicators (KPIs) is incredibly important. However, the challenge most firms face lies in ensuring that the data is both comprehensive and accurate. That's where BQE CORE steps in, bringing precision and depth to your data analysis and KPI tracking.
In this blog, we’ll discuss how BQE CORE can aid you in scrutinizing eight fundamental KPIs — overhead multiplier, utilization rate, effective cost rate, net multiplier, aged accounts receivable, work in progress, profits-to-earning ratio, and net revenue per employee. Each of these metrics forms the backbone of a successful business, and with BQE CORE, you can effortlessly gain critical insights that lead to data-driven decisions, robust growth, and maximized opportunities.
Say goodbye to the days of getting lost in spreadsheets and prepare to embrace a more accurate, holistic, and data-driven approach to managing your company's performance.
With BQE CORE, not only can you track your most important KPIs, but you can also compile all of this information into specified reports so that you can share data critical to the success of your company. Over time, BQE CORE helps you establish a deeper understanding between company KPIs, project KPIs, employee KPIs, and even client and vendor KPIs. This data, combined with an understanding of the working relationship between each entity, will have a deep and lasting impact on the decisions and growth of your company.
BQE CORE tracks each level of performance (top-down) for all aspects of your business. This data is made available through customizable dashboards, performance tabs, and reports. By using data-driven leadership, companies have the opportunity to identify weaknesses, create growth, and maximize opportunities within the organization.
Projects (also called engagements, jobs, or matters, depending on the service industry) are the framework around which service providers do business. There are many metrics that you should regularly check to ensure that everything is on track. If you have to track and calculate everything on your own, through spreadsheet after spreadsheet, staying on top of it can be difficult.
Even if your firm has implemented technology to assist in this effort, some of the most sophisticated project management software doesn’t make data access and analysis as easy as it should be.
With a solution like BQE CORE, project management is easier, helping you to keep track of a range of key project performance indicators. BQE CORE provides several ways to interface with that data, allowing project managers the flexibility to engage with the data in a way that is best suited to drive results for the company and team.
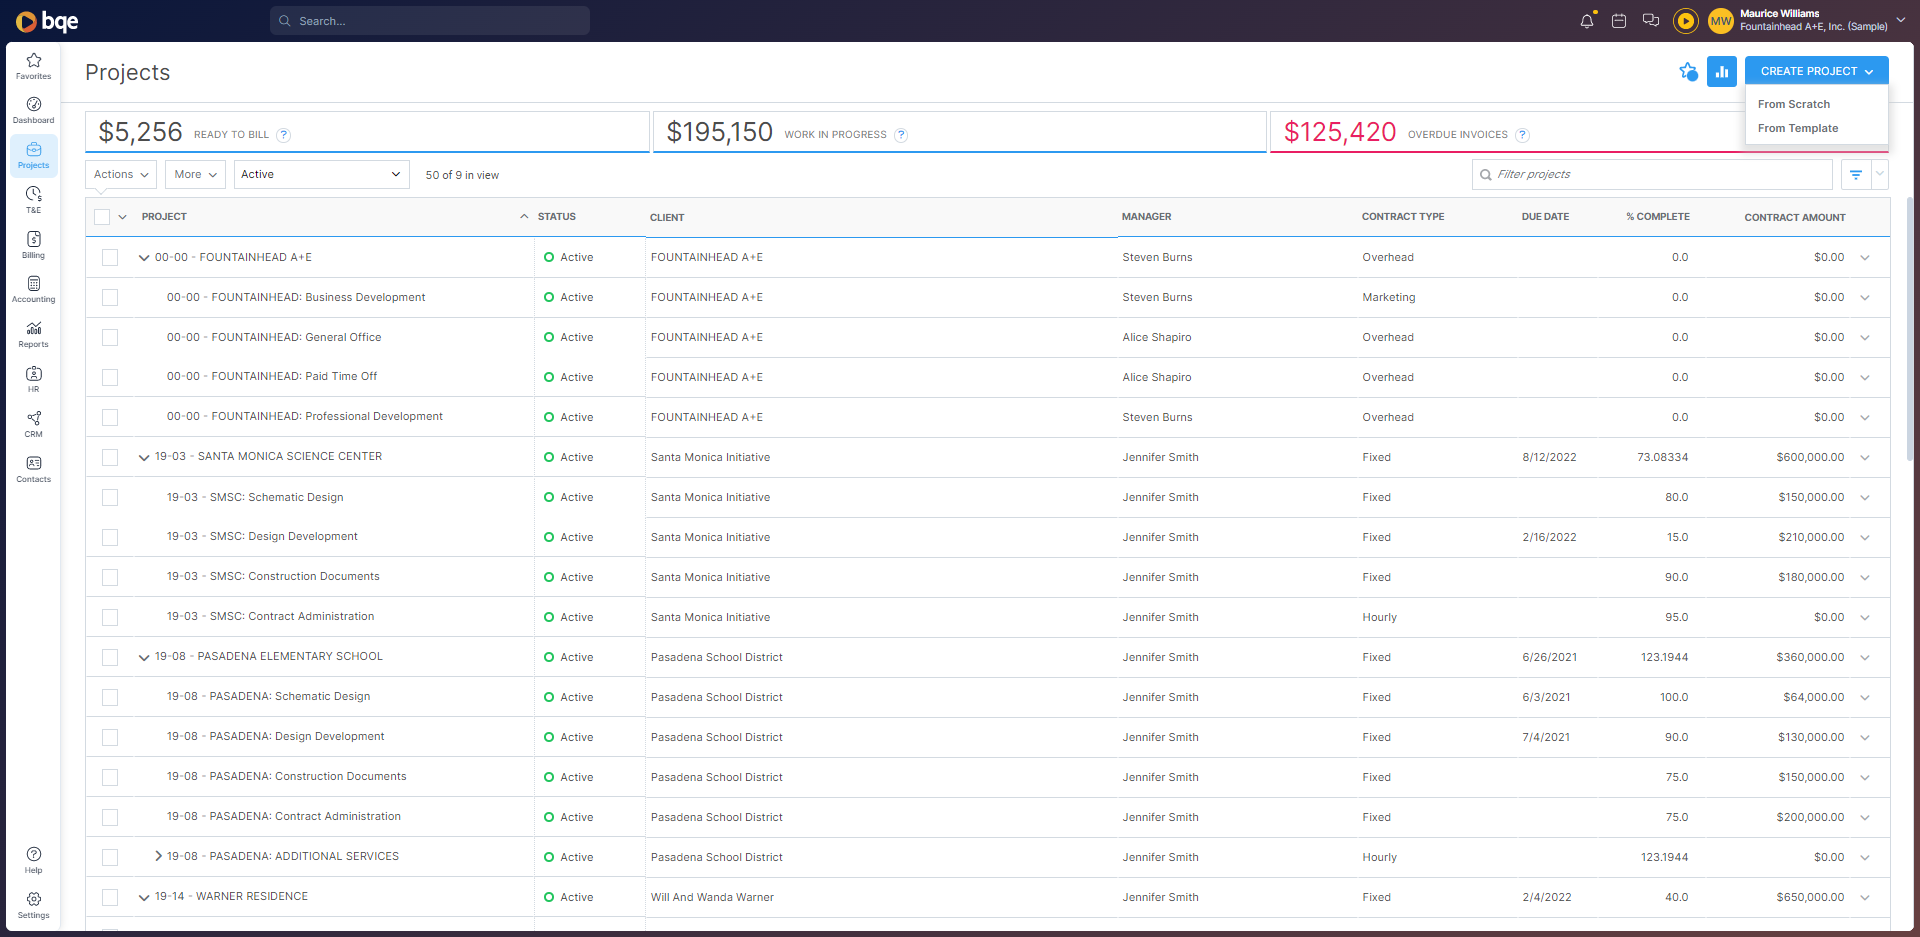
When it comes to tracking KPIs, you need BQE CORE’s project screen for real-time view into every aspect of your project. BQE CORE’s project screen gives you a brief and clean overview of your current projects as well as high-level financials. You can see what’s ready to bill, your work in progress, and what’s overdue.
After you click into a project, you can move over to the “performance” tab on the top right. Then, select a date range to focus your analysis.
%20Performance%20-%20Dashboard%20-%20Full%209%20Widgets%20(1).png?width=1920&height=937&name=Delta%20Team%20(Steves%20Team)%20Performance%20-%20Dashboard%20-%20Full%209%20Widgets%20(1).png)
This screen shows you everything you need to know about the state of your project including:
This crucial KPI quantifies the ratio of non-project-related expenditures (which includes indirect costs such as non-project labor) to total direct labor. It’s represented as a percentage and plays a pivotal role in accurately gauging a firm’s profitability.
BQE CORE helps you track and manage the Overhead Multiplier KPI by capturing and segregating all financial data accurately, distinguishing between indirect and direct expenses.
This distinction allows you to swiftly calculate the Overhead Multiplier by dividing total indirect expenses by total direct labor, all within the software. It's also equipped with real-time dashboards and reporting functions that highlight the Overhead Multiplier KPI, making it easier to track and manage.
With BQE CORE, you'll not only be alerted when your Overhead Multiplier surpasses the optimal limit of 1.75, but you can also use the software's analytical tools to identify areas where indirect expenses can be curtailed, ensuring your company maintains a healthy profit margin.
This metric is crucial if you’re billing hourly or hourly-not-to-exceed. It is very useful information even if you are working on a fixed-fee project. You will gain a clear picture of your project’s efficiency in terms of billable versus non-billable hours.
BQE CORE automates the tracking of both billable and non-billable hours, ensuring accuracy and saving time. The software also seamlessly calculates the Utilization Rate by dividing billable hours by total hours worked, offering you an immediate and accurate snapshot of team performance.
The intuitive dashboards and reporting functionalities within BQE CORE make it easy to monitor these rates in real-time, identify trends, and spot any underutilization quickly. If utilization rates drop, you can use BQE CORE's in-depth analysis tools to identify areas for improvement, boosting both productivity and profitability.
The Effective Cost Rate signifies the real cost of employing an individual, taking into account the specific nature of the work they undertake. This metric plays an important role as it delivers a transparent view of an employee's cost on an hourly basis. It serves as a valuable guide in setting appropriate billing rates for each employee's services, thereby aiding in the pursuit of profitability.
BQE CORE brings valuable clarity to your Effective Cost Rate, offering a deeper understanding of your human resource investments. By meticulously tracking and analyzing the specifics of each employee's work— from the tasks they perform to the time they spend — BQE CORE paints a comprehensive and precise picture of the actual cost per hour of employing each individual.
This data is not just necessary for assessing overheads, but it also plays an integral role in setting strategic and profitable billing rates for each employee's services. BQE CORE's analytical tools and reporting functionalities further allow you to monitor these rates over time, compare them against industry standards, and identify trends, thereby ensuring that your human resource investments are consistently aligned with your profitability goals.
The Net Multiplier is the proportion of net operating revenue to total direct labor.
Think of your direct labor as an investment. The Net Multiplier serves a barometer of the returns you gain on this investment. It provides a clear illustration of the revenue you generate for each dollar spent on direct labor so it offers a tangible measure of your performance.
BQE CORE captures all financial data and ensures that both net operating revenue and total direct labor are accurately logged and distinguished.
This precise data capture sets the stage for an effortless calculation of the Net Multiplier, achieved by dividing net operating revenue by total direct labor, directly within the software. BQE CORE's user-friendly dashboards and real-time reporting functions highlight the Net Multiplier, making monitoring and managing this crucial KPI simple and efficient.
BQE CORE's analytic tools can provide insights into trends, patterns, and deviations in your Net Multiplier over time, empowering you to make data-driven decisions for optimizing labor efficiency and improving profitability.
Accounts Receivable Aging illustrates outstanding customer invoices and unapplied credit notes, segmented by date ranges.
This KPI proves invaluable in identifying invoices that have surpassed their due dates, providing a snapshot of the payment timelines associated with your clients.
BQE CORE maintains a comprehensive record of all customer invoices and credit memos, diligently tracking their dates and status. By segmenting these into specified date ranges, BQE CORE provides a clear and instant visualization of your outstanding receivables and their age.
You can quickly identify overdue invoices and potentially problematic payment patterns. The software simplifies the calculation of your average aged accounts receivable, showing the typical timeline from the issuance of an invoice to the receipt of payment.
Work in Progress (WIP) covers the billable time and expenses that are completed but have not yet been billed. It not only tells project managers how far along work is, but it gives a clear indication of upcoming cashflow.
BQE CORE keeps a detailed record of all ongoing work, capturing billable hours and associated expenses that have been accrued but not yet invoiced. The real-time tracking ensures your WIP data is always up-to-date, providing a comprehensive snapshot at any given time.
It also generates insightful reports that offer a clear view of the work's progress against the original estimates, enabling you to foresee potential overruns or bottlenecks. Its dashboard visualizations and custom reporting capabilities make it easy to analyze and understand your WIP, facilitating proactive decision-making and better project management.
The Profits-to-Earnings ratio shows a firm’s aptitude in executing projects with profitable outcomes. This ratio is calculated by dividing the net profit by the net operating revenue. It serves as a decisive metric, illuminating the firm’s proficiency in transforming revenues into actual profits.
BQE CORE intelligently consolidates data related to your firm's revenues and operating expenses, facilitating precise calculation of net profit after accounting for expenses and salaries but before non-salary distributions and taxes.
By dividing this net profit figure by the net operating revenue, BQE CORE presents an accurate Profit-to-Earnings ratio. This valuable insight is provided in real-time and can be included in customized reports or visualized on dashboards for easy comprehension and informed decision-making.
The Net Revenue per Employee metric indicates the average amount of revenue that each member of your staff contributes.
This measure provides valuable insight into the productivity and efficiency of your firm in generating revenue.
BQE CORE collates data about your firm's total net revenue and the number of employees, then automatically calculates this metric. By using BQE CORE, you can track this KPI in real-time, observing trends over different periods and making informed decisions about personnel and resource allocation. The software's intuitive dashboards and customizable reports make this information readily accessible and easy to comprehend, aiding your strategic planning and operational efficiency.
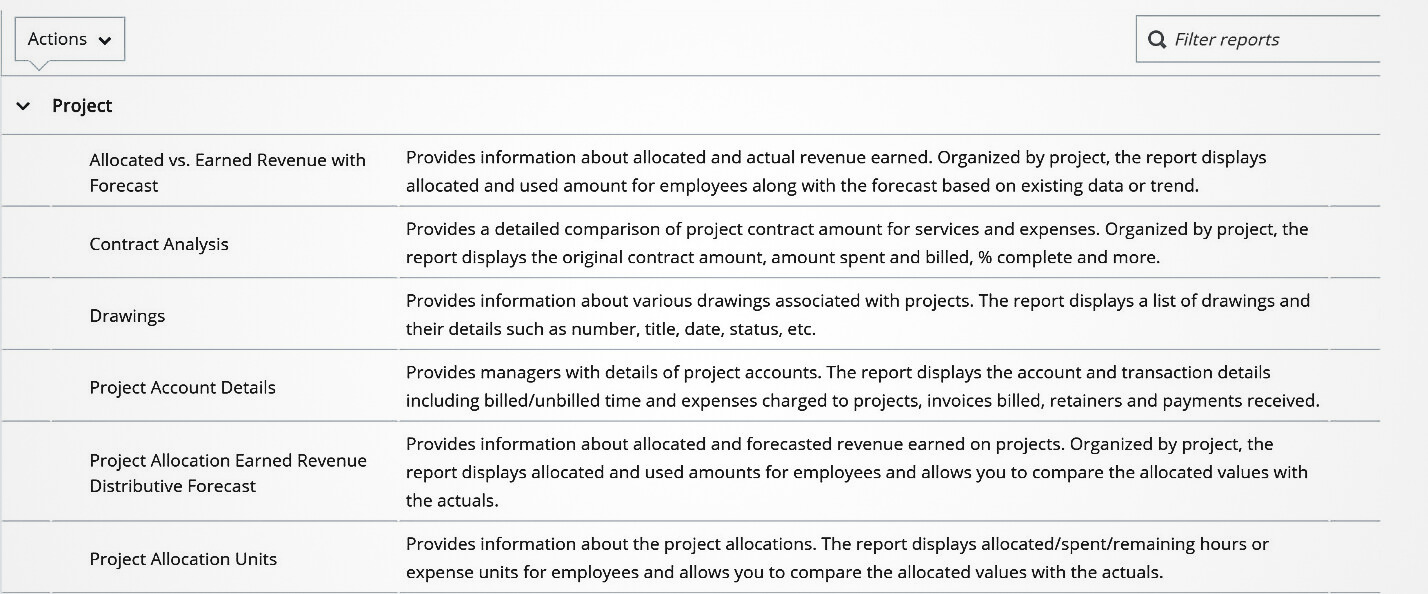
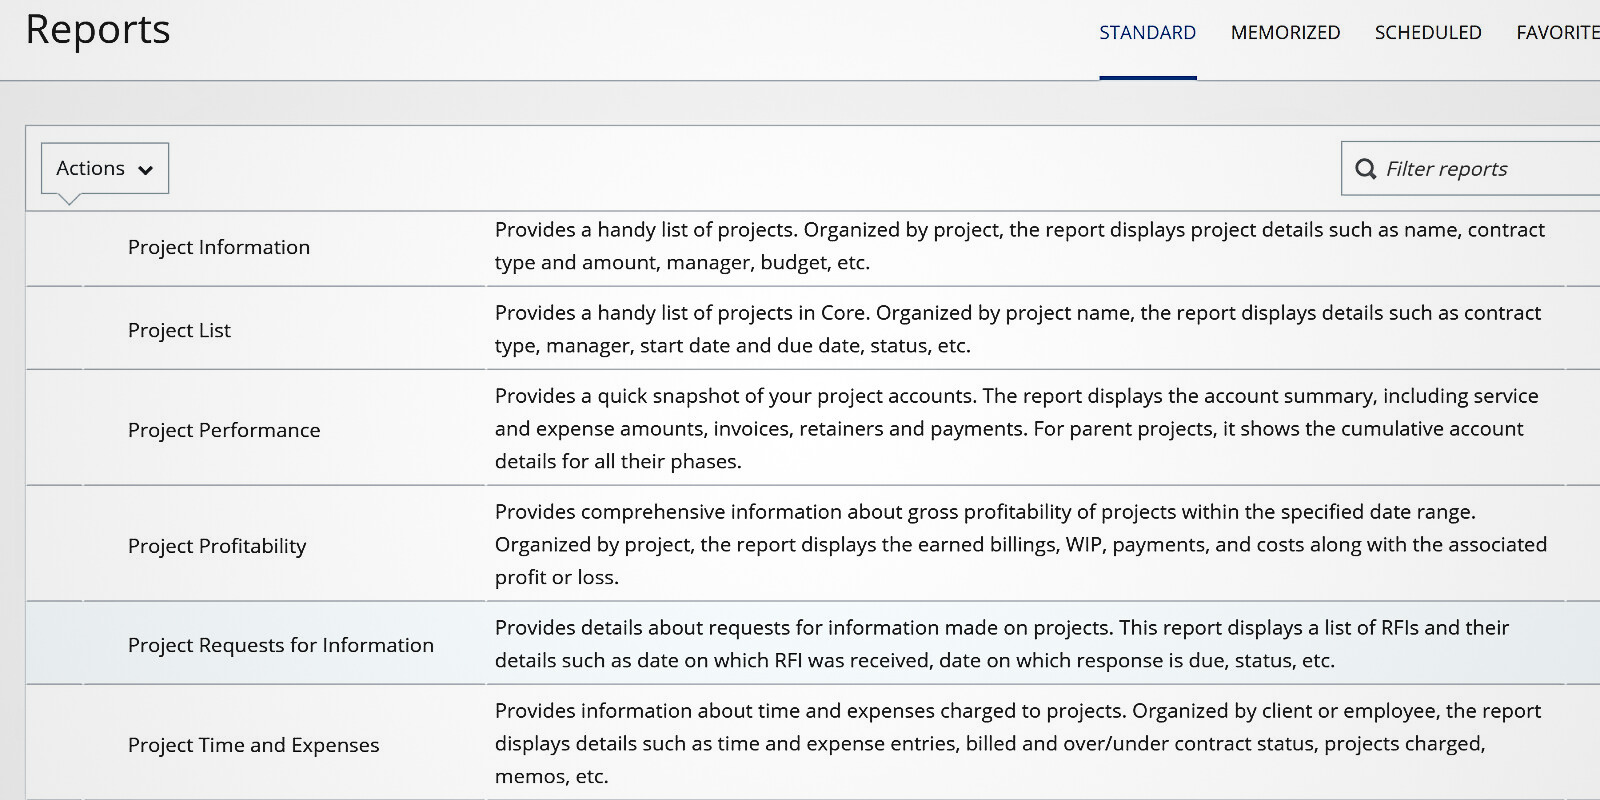
The Report Center in BQE CORE offers many valuable reports for employees spanning every level of an organization. The Project Reports in BQE CORE give you an overview of every aspect of the project status and performance.
Each report can be filtered and customized to focus on performance by project manager, project, phase, date range, client, and so much more. And all reports are simply a click away. Moreover, reports can be memorized for easy access or scheduled to be automatically delivered via email to your team.
As you are using reports to analyze your projects, you should perform the same two analyses:
Which ones did well, and why?
Which ones did poorly, and why?
The winning strategy of any firm is to evolve your operations to be better, faster, and more efficient. Without the understanding, evaluation, and application of data, managers cannot measure growth or success.
While you might not use every KPI in this blog for every project, it’s important to have a clear understanding of what opportunity exists within each data point. And if you are calculating information on your own or using cumbersome software, it’s extremely helpful to have a comprehensive list of what metrics you need to check.
When you use BQE CORE, these metrics are calculated in real-time per project, as a whole, and phase-by-phase. These indicators—if checked throughout the life of your project—will help ensure that things come together on time and on budget.
Track your financial budgets with BQE CORE so that you can share data critical to the success of your company.
If you're not yet using the Allocation and Forecasting features in BQE CORE, you're missing out on vital information such as predicting workload and...
If you are new to CORE, the first 30 days will prime your firm for the success you seek from the power of the software you selected.