The term “management software” encompasses a broad array of software products from spreadsheets, to-do management, accounting, billing, scheduling, budgeting, etc. to higher machine learning business intelligence platforms. However, if your software isn’t designed (out-of-the-box), to yield KPIs (Key Performance Indicators), and meaningful reports, you are wasting your time. Trying to manage a firm without the right data visualization software is like running a marathon in flip-flops: you're at a clear disadvantage, and everyone wonders why you'd make it so hard on yourself!
Here’s a double binary: either your A/E firm has management software, or it doesn’t. And, if your firm has management software, either you’re leveraging it or not.
Leverage Your Analytics Software
If your firm has management software but you’re not leveraging the data analytics and reporting functions, why are you even bothering to use it? My guess is someone in your firm had the right intention, did the research to figure out which automation software makes sense for your business, and paid money to use the software but never really got around to learning how to use it and exploit it. In addition, these tools were never shared with your staff and they are likewise missing out on a valuable asset with impressive analytics capabilities just gathering dust in some hard drive in your office or the cloud.
Of course, it should come as no surprise, if your firm is not currently using management software that can leverage data, you are missing out on one of the most valuable tools to increase profitability while simultaneously relieving stress by streamlining your workflows.
Running With the Herd
Having worked closely with more than 1,300 firms in my career, I can tell you that most are run with the aid of Excel spreadsheets and intuition. I have seen countless spreadsheets that are worthy of a Rube Goldberg Award and observed “intuitive” decisions that perplex the mind. My goal is to put an end to these travesties.
While intuition, experience, and gut feelings have their place in decision-making, relying on these without leveraging insights from data will most likely leave your firm in the dust. Running a business on intuition alone, and not analytical skills, is like assembling furniture without the instruction manual; you have some key pieces, but without the guidelines, you're likely to end up with something wobbly and unreliable.
10 Reasons to Depart from the Herd
-
Changing Dynamics: Market conditions, customer preferences, and even global politics can change rapidly. Relying solely on past experiences can leave a business unprepared for current challenges.
-
Unconscious Bias: Gut feelings can often be influenced by personal biases that can cloud judgment. This might lead to decisions that are not in the best interest of the business or your bottom line.
-
The Complexity of Modern Business: Data can help untangle this web and provide insights that might be missed by relying on intuition alone.
-
Scalability: Data-driven decisions allow for scalability, ensuring that even as the business expands, decisions are made with a consistent and reliable foundation.
-
Competitive Edge: All of today's leading businesses are data-driven. By not leveraging data, a business might be putting itself at a competitive disadvantage.
-
Risk Management: Data can help identify potential risks and challenges before they become problematic. Relying on intuition might not provide the same early warning system.
-
Objective Evaluation: Data provides an objective basis upon which to evaluate strategies and initiatives. Data enables businesses to accurately determine what's working and what's not.
-
Innovation and Exploration: Data can unveil hidden patterns, new market segments, or unmet customer needs, leading to innovative products or services. Intuition, being based on the familiar, might not push a business into new territories.
-
Efficiency and Resource Allocation: Data can help businesses identify inefficiencies in their operations. Relying on gut feelings means that resources are not used to their full potential.
-
Customer Insights: While intuition might provide a broad understanding, data can offer granular insights into client behavior, preferences, and pain points.
The Changing Landscape of the A/E Industry
The good old days of a face-to-face meeting with your client before, returning to your studio to make sketches, play with wood or clay models, and eventually walk the site like Howard Roark are long gone. The A/E industry has witnessed a significant surge in complexity over recent years. This can be attributed to a myriad of reasons, and it affects the way professionals in the field operate, collaborate, and deliver on their projects.
We’re all familiar with the advancements in Building Information Modeling (BIM), which enable us to create and utilize detailed 3D models of a building or structure. While this brings about efficiency and collaboration, it also introduces complexities in terms of data management, software compatibility, and the need for continuous upskilling. I can almost guarantee that your firm has this on your radar.
Here's a closer look at the other side of the brain - how business management is being challenged and evolving:
Project Management:
Scalability
As projects grow in complexity, firms must invest in more sophisticated project management tools that can handle multi-faceted projects spanning months or even years.
Resource Allocation
Managers must ensure that the right talent is allocated to the right task, balancing the demands of multiple concurrent projects.
Financial Management:
Budgeting
Complex and in-depth projects require more precise budget forecasts. Unexpected complications, changes in client demands, or fluctuating material prices can significantly impact costs.
Cash Flow
Extended project timelines and phased billing schedules mean firms must carefully manage cash flow to maintain operational health.
Human Resources and Talent Management:
Upskilling
Continuous training and development become essential as the A/E industry adopts new technologies and methodologies.
Recruitment
There's a need to hire specialists to address the increasing demands of projects, from sustainability experts to BIM modelers.
Client Relationship Management:
Stakeholder Communication
Keeping stakeholders informed and managing their expectations in the face of complex projects is crucial.
Feedback Loops
Firms need systems to capture and act on client feedback efficiently, ensuring alignment with client vision and requirements.
Client Onboarding Processes
Effective onboarding sets expectations, aligns goals, and builds trust, laying the foundation for smoother projects and stronger client relationships. Start by downloading this free Client Onboarding Checklist.
Technology and Data Management:
Integrated Software Solutions
As A/E processes become intertwined, firms are looking for integrated software solutions that cater to design, simulation, project management, and client communication.
Cybersecurity
With the rise of digital tools and dashboards, there's an increasing need to secure sensitive project data and client information.
Business Development and Marketing:
Diversification
In an industry where client demands are varied and specific, firms may need to diversify their offerings, requiring clear market segmentation and targeted marketing strategies.
Portfolio Management
Showcasing a diverse range of projects that reflect the firm's adaptability and prowess in handling complex demands can give a competitive edge.
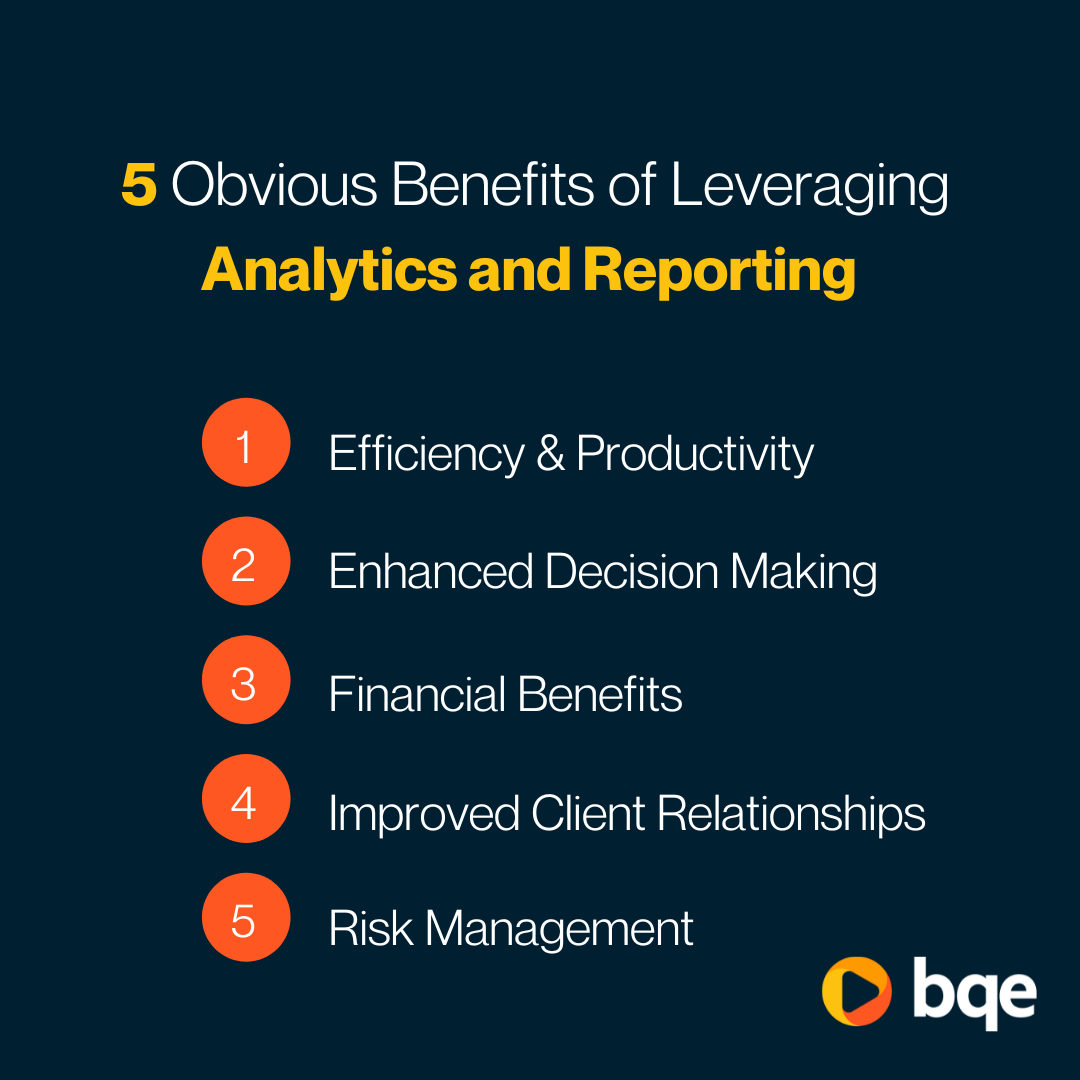
Reporting and Analytics Combined
Hopefully, I’m making the case for why your firm must be implementing technologies that leverage real-time data. Now, I need to explain what the difference is between analytics and reporting.
Both reporting and analytics transform raw data into more comprehensible and actionable insights, helping stakeholders make informed decisions.
Here's how each one offers insights that raw, unprocessed data cannot:
Reporting:
Snapshot in Time
Reporting is the process of collecting and presenting data in a structured and often standardized format. It provides a snapshot of specific information at a particular point in time. For most firms, reports are really just a post-mortem.
Structure and Organization
Reporting collates and organizes this data into a structured format, helping in better visualization and comprehension.
Summarization
Instead of sifting through thousands of data points, one can quickly understand key metrics or figures.
Standardization
Reporting often involves standardizing data so that it's consistent across all periods. This helps in comparing different time frames or different segments of data.
Contextualization
Reporting might juxtapose different data sets to give them context. For example, raw data might show two months of sales figures, but a report can show them side by side, helping understand growth or decline.
Analytics:
Discovery of Patterns
One of the most significant advantages of analytics over raw data is its ability to discover hidden patterns and trends. For instance, while raw data might show fluctuations in project timelines, analytics can identify specific factors that frequently lead to project delays.
Predictive Insights
Analytics tools utilize statistical methods and algorithms to forecast future trends. Raw data alone cannot provide predictions about future outcomes.
Correlation and Causation
Analytics can help identify relationships between different data points. For example, while raw data might show an increase in construction costs and project delays, analytics can help determine if (and how strongly) the two are correlated.
Segmentation
Analytics can segment data into various categories, helping to understand patterns in specific groups. For instance, while raw data might provide a list of all clients, analytics can segment them based on project size or frequency, revealing insights about which client segments are the most profitable.
Prescriptive Analysis
Beyond just understanding the past and predicting the future, analytics can also provide recommendations on the best course of action to achieve desired outcomes.
Interactivity
Modern cloud-based analytics tools allow users to interact with data dynamically, changing parameters, drilling down to granular levels, or visualizing data in various formats to uncover deeper insights.
How To Implement Analytics and Reporting in Your Firm
Choosing the Right Software
There are numerous offerings on the market that your firm can consider. My advice is to stick with a solution that is built around the unique needs of the A/E industry and make sure it fits your culture and can grow with you. I’ve never been shy about promoting BQE CORE for nearly every firm I’ve engaged with.
Training & Onboarding
I can’t stress enough the importance of educating team members on the value of data analysis and how to interpret analytics and reports. Once you have worked with your software provider/implementer, make sure everyone in the firm understands why you have committed to it and how they should interact with its valuable insights.
Regular Review & Iteration
This is not a decide-and-move-on situation. Regularly, review with your team how the adoption is going. Find the cracks and work with your software vendor/implementer/trainer to improve and adjust. Learn from past mistakes and make better decisions, don’t blame the technology. You and your technology must continuously evolve to reach your business goals.
If you’re looking for guidance, I’m always available to talk with your firm as a business growth consultant for the A/E industry. Don’t be shy. I don’t bite!
Try a Free Demo of BQE CORE
BQE CORE is firm management software that provides an all-in-one dashboard for project management, reporting and data-driven insights/analytics, time and expense tracking, billing and invoicing, and more.
Created by an architect and an engineer for the professional services industry, our tool makes your decision-making processes easy by providing you with the software you need to easily manage your projects and increase your profitability. With a free demo, you can see just how easy it can be to leverage your analytics and reporting with the right software, designed with your firm in mind.