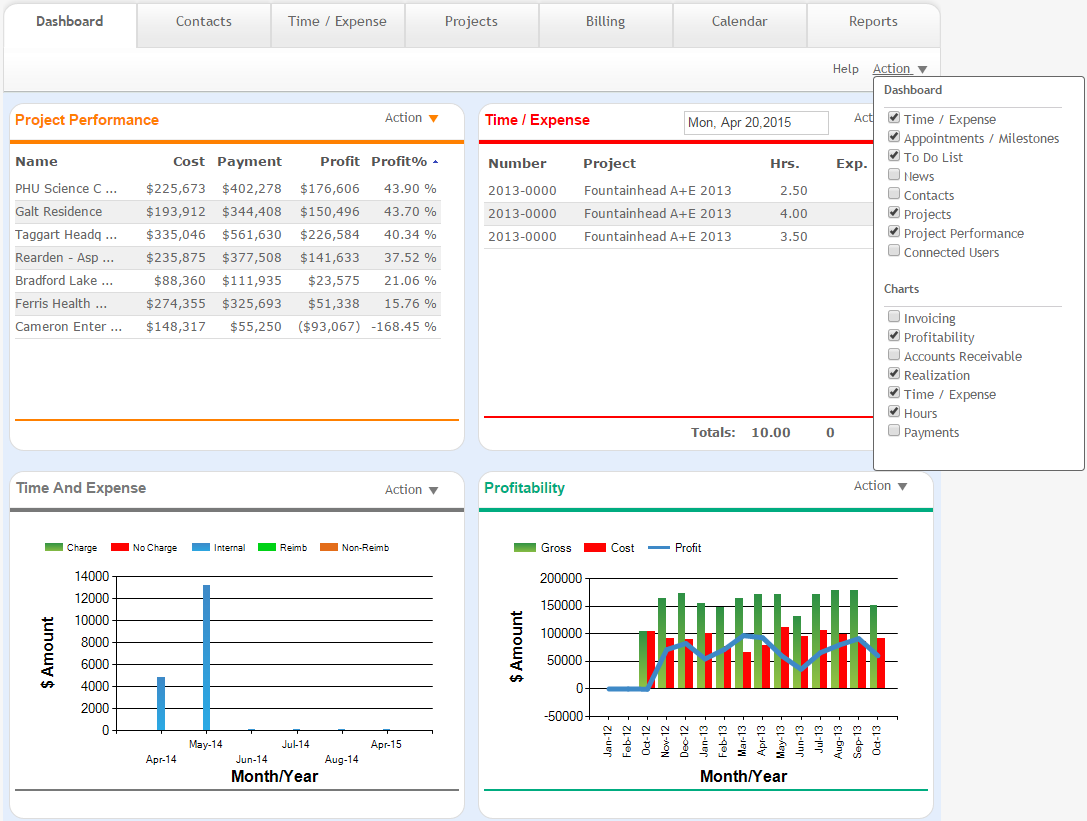
The ArchiOffice Dashboard is the first thing you see when you log in. It gives you a quick snapshot of the current activity in ArchiOffice. It displays widgets (that is, mini applications) that give you a quick view of the various modules of ArchiOffice (that is, Time/Expense, Appointments/Milestones, To Do List, News, Contacts, Projects and Project Performance, and Connected Users). The Dashboard also displays charts that provide a financial snapshot of your business (Invoicing, Profitability, Accounts Receivable, Realization, Time/Expense, Hours and Payments). However, this feature is available in the ArchiOffice Pro and Enterprise editions only.
The Dashboard is also user-specific. You can add, remove or re-arrange the widgets to suit your unique needs using the Action drop-down. The widgets displayed on the dashboard are determined by your security settings. These are configured by your ArchiOffice Administrator in the Preferences screen. Up to 15 widgets can be displayed on the Dashboard, including:
The ArchiOffice dashboard is highly customizable. You can enable or disable widgets, move them around by dragging-and-dropping, and minimize them to save space. You can sort the content of the dashboard widgets having lists (e.g., To-Do List) by clicking the column headers. Watch the above video to learn more!